Solana (SOL) Tests Recovery Momentum: Can It Charge Toward the $100 Barrier?
- Solana is currently hovering at the $92 zone.
- SOL has seen a 24-hour liquidation of $19.90M.
With a brief 2.13% spike, a green shade has rolled out across the crypto assets. Will the bullish move sustain and trigger a steady recovery? As the market is fluctuating heavily, both the red and green charts are found. Among the altcoin pack, Solana (SOL) has registered a 2.74% gain in value over the 24 hours.
In the morning hours, the asset traded at $88.79. As SOL bulls entered the market, the price rose to a high range of $93.83. With a $52.29 billion market cap, Solana currently trades at $92.23. Besides, the trading volume has reached $5.75 billion. Concurrently, the SOL market has witnessed $19.90 million in liquidations.
The Ali chart shows that a large cluster of supply sits around $85.55, making it a strong support zone. If Solana holds above this, the bullish momentum could push the price toward the $115.04 mark, where the next major concentration appears. Also, it might act as the next resistance level.
If the ongoing uptrend gains more traction, the Solana price may climb to the resistance at $92.53. With the potential bulls triggering the golden cross to unfold, the price could move up above $92.85. Assuming SOL takes a bearish turn, the price could slip to the $91.93 support range. A breakdown from this level might push the death cross to take place, gradually, sending the asset’s price below $91.60.
Bullish Crossover Emerges on Solana’s Technical Charts
The technical analysis of Solana reveals that the Moving Average Convergence Divergence (MACD) line is settled above the signal line. It displays that bullish momentum is building, and the short-term price action is stronger than the recent average.
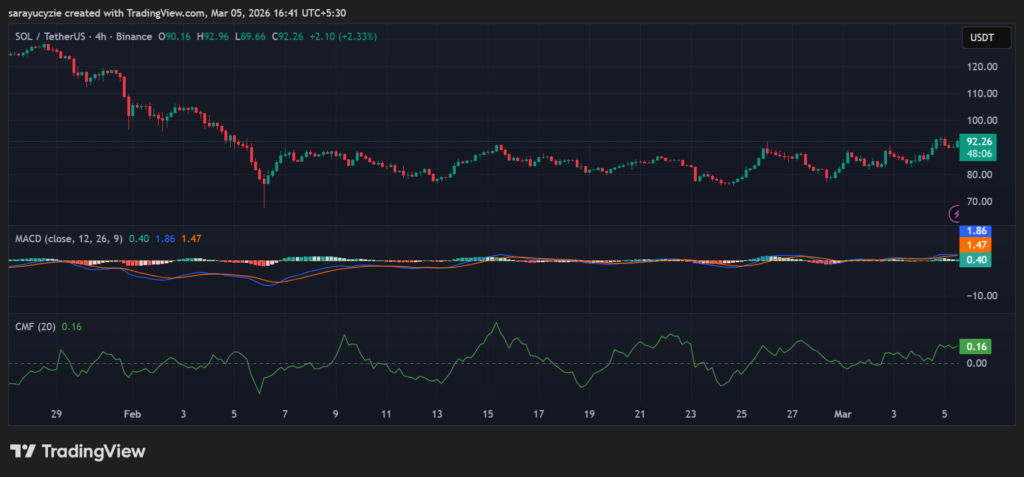 SOL chart (Source: TradingView)
SOL’s Chaikin Money Flow (CMF) indicator is located at 0.16 shows moderate buying pressure. The capital is flowing into the asset, supporting the current price movement. It reflects improving market sentiment and steady demand in the market.
In addition, the daily Relative Strength Index (RSI) value of SOL at 62.87 hints at moderate bullish sentiment. Significantly, as it is above the neutral level, there is a steady buying strength, with more room for further upside without being overstretched.
Solana’s Bull Bear Power (BBP) reading of 3.77 exhibits strong bullish pressure, and the buyers are clearly in control of the market. Notably, if it continues to rise, it could support further upside, and a decline toward zero weakens the bullish strength.
Top Updated Crypto News
Pump.fun (PUMP) Price Battle: Surge Reload or Downside Drift Ahead?


You May Also Like

Veterans losing their homes in droves after Trump ignored major warning: report
![Can edgeX [EDGE] rebound after its 17% drop? THESE signals say…](https://i1.wp.com/ambcrypto.com/wp-content/uploads/2026/04/Abdul-2026-04-19T121716.811-e1776597537620.webp)
Can edgeX [EDGE] rebound after its 17% drop? THESE signals say…