Ethereum’s liquidation map shows an extreme short positioning imbalance, with cumulative short liquidation leverage dwarfing long exposure at current prices nearEthereum’s liquidation map shows an extreme short positioning imbalance, with cumulative short liquidation leverage dwarfing long exposure at current prices near

There Are 12 Times More ETH Shorts Than Longs: Here Is What That Means for Price

2026/03/08 22:32
3 min read
For feedback or concerns regarding this content, please contact us at crypto.news@mexc.com

Ethereum’s liquidation map shows an extreme short positioning imbalance, with cumulative short liquidation leverage dwarfing long exposure at current prices near $1,978.

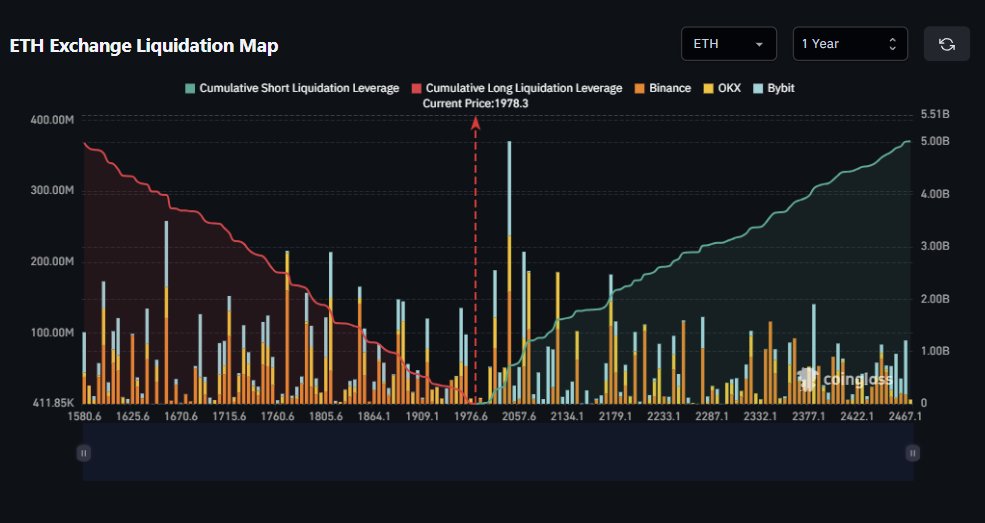
What the Liquidation Map Shows

The Coinglass ETH Exchange Liquidation Map covers a price range from roughly $1,580 to $2,467, with current price sitting at $1,978.3, marked by the red dashed vertical line near the centre of the chart.

Two cumulative lines run across the chart.

Source: https://www.coinglass.com

The red line tracking cumulative long liquidation leverage starts high on the left side of the chart, above $350 million, and slopes downward consistently as price moves right toward current levels. That declining red line means long liquidation pressure has been largely absorbed. Most leveraged longs below current price have already been wiped out.

The green line tracking cumulative short liquidation leverage tells the opposite story. It starts low on the left and curves sharply upward to the right, reaching $5.51 billion at the far right of the chart. The higher price goes, the more short positions get liquidated. That $5.51 billion sitting above current price represents compressed fuel for a short squeeze if price moves up.

The individual bars show exchange-specific liquidation clusters by price level, broken down across Binance in orange, OKX in yellow, and Bybit in blue. The largest single bar cluster sits just above current price around $2,057, representing the densest concentration of short liquidations immediately above the market.

What 12x Short Dominance Actually Means

The ratio reported by Coinglass is stark. Over 12 times more ETH short leverage exists than long leverage at current price levels. That kind of imbalance creates an asymmetric setup in either direction.

In one scenario, a short squeeze. If price pushes above $2,057 and triggers the dense liquidation cluster visible on the chart, forced buying from short closures could accelerate the move rapidly. The $5.51 billion in cumulative short liquidation leverage sitting above current price is the fuel for that scenario.

Solana Payment Volume Up 755%: The Ecosystem Map Shows Why

In the other scenario, the shorts are right. If price continues lower, the long liquidation pressure visible on the left side of the chart has already been cleared, meaning there is limited forced selling below. But the sheer volume of short positioning also means the market has a strong directional consensus betting on further downside.

How This Connects to the Broader ETH Picture

This data sits alongside the multi-cycle trendline analysis covered earlier this week. Crypto Tice identified the current ETH level as hold or collapse, with the weekly close as the deciding event. The liquidation map adds a mechanical layer to that structural argument. A hold and recovery scenario has $5.51 billion in short liquidations sitting above price that could amplify any upside move. A breakdown scenario clears through a long side that has already been largely liquidated.

The positioning is extreme. Extreme positioning resolves fast when it moves.

The post There Are 12 Times More ETH Shorts Than Longs: Here Is What That Means for Price appeared first on ETHNews.

Market Opportunity
Ethereum Logo
Ethereum Price(ETH)
$2,050.29
$2,050.29$2,050.29
-1.39%
USD
Ethereum (ETH) Live Price Chart
Disclaimer: The articles reposted on this site are sourced from public platforms and are provided for informational purposes only. They do not necessarily reflect the views of MEXC. All rights remain with the original authors. If you believe any content infringes on third-party rights, please contact crypto.news@mexc.com for removal. MEXC makes no guarantees regarding the accuracy, completeness, or timeliness of the content and is not responsible for any actions taken based on the information provided. The content does not constitute financial, legal, or other professional advice, nor should it be considered a recommendation or endorsement by MEXC.

You May Also Like

The $40 Million ‘Free Money’ Glitch in Crypto Prediction Markets

The $40 Million ‘Free Money’ Glitch in Crypto Prediction Markets

The post The $40 Million ‘Free Money’ Glitch in Crypto Prediction Markets appeared on BitcoinEthereumNews.com. In brief Researchers found $40 million in “risk-free” profits from mispriced markets on Polymarket in one year. Prices on some markets didn’t add up to 100%, letting traders lock in guaranteed gains. The same inefficiencies likely exist on other platforms like Myriad and Kalshi, though arbitrageurs help correct them. A new academic paper suggests there’s been a steady stream of “free money” lying around on Polymarket—and smart traders have been scooping it up. The paper, Unravelling the Probabilistic Forest: Arbitrage in Prediction Markets, is the most detailed look yet at how mispricing creeps into crypto’s most popular prediction platform. The researchers combed through a year of data, from April 2024 to April 2025, and found thousands of instances where market prices simply didn’t add up. In some cases, the prices of “Yes” and “No” shares in a single market didn’t sum to one dollar as they theoretically should, creating a risk-free profit for anyone quick enough to pounce.  In other cases, the mispricing was more subtle, involving logically related markets. For example, a market on “Trump wins the presidency” might trade at very different odds than “Republican wins the presidency,” even though those outcomes are tightly linked. By buying and selling combinations of these contracts, a savvy trader could lock in a profit no matter what happens. The researchers estimate more than $40 million in profits have already been pulled from the system by arbitrageurs, traders who specialize in sniffing out and exploiting these kinds of inconsistencies. Far from being a theoretical curiosity, this is a live and lucrative business model. Is this pattern true across all prediction markets? What’s striking is how common these opportunities are. The study found more than 7,000 markets with measurable mispricing, many in highly liquid, closely watched contracts. “Prediction markets are often treated…
Share
BitcoinEthereumNews2025/09/18 14:34
Trump Iran War Resolution: President Claims He Can End Conflict Anytime, Expects Swift Conclusion

Trump Iran War Resolution: President Claims He Can End Conflict Anytime, Expects Swift Conclusion

BitcoinWorld Trump Iran War Resolution: President Claims He Can End Conflict Anytime, Expects Swift Conclusion WASHINGTON, D.C. — President Donald Trump asserted
Share
bitcoinworld2026/03/11 22:50
Will the crypto market rally after February U.S. CPI holds at 2.4% as forecasted?

Will the crypto market rally after February U.S. CPI holds at 2.4% as forecasted?

The crypto market showed a muted reaction after US CPI data held at 2.4%, leaving investors watching Federal Reserve policy and Bitcoin price levels. The latest
Share
Crypto.news2026/03/11 22:37