The Silver price is trading around $84 per ounce after a wild start to the year. Back in January, the metal pushed above $110, but that rally didn’t last long.TheThe Silver price is trading around $84 per ounce after a wild start to the year. Back in January, the metal pushed above $110, but that rally didn’t last long.The

Here’s Where Silver Price Could Be Headed This Week

2026/03/09 05:00
4 min read
For feedback or concerns regarding this content, please contact us at crypto.news@mexc.com

The Silver price is trading around $84 per ounce after a wild start to the year. Back in January, the metal pushed above $110, but that rally didn’t last long.The price declined rapidly after that before stabilizing at the mid-$80s, where it is today.

A few big forces are pushing the silver market right now. One of them is simple demand. Silver is used heavily in solar panels and battery technology, and those industries keep growing. That steady industrial use keeps a strong floor under the metal.

However, some investors are moving back into precious metals because of rising tensions around the world, especially the situation between the U.S. and Iran. When uncertainty rises, metals like silver often see more buying.

Silver is also following gold’s direction. Gold has stayed firm this year as investors look for places to park money when inflation and economic worries start showing up again. Rising oil prices are adding pressure as well because higher energy costs often push inflation fears higher.

There are also some changes in the physical market. India is looking into alternatives to LBMA pricing, and this could lead to a change in the pricing of silver in the long term.

In conclusion, the market seems unstable in the short term, although it seems to be doing well in terms of demand.

Here’s What The Silver Chart Is Showing

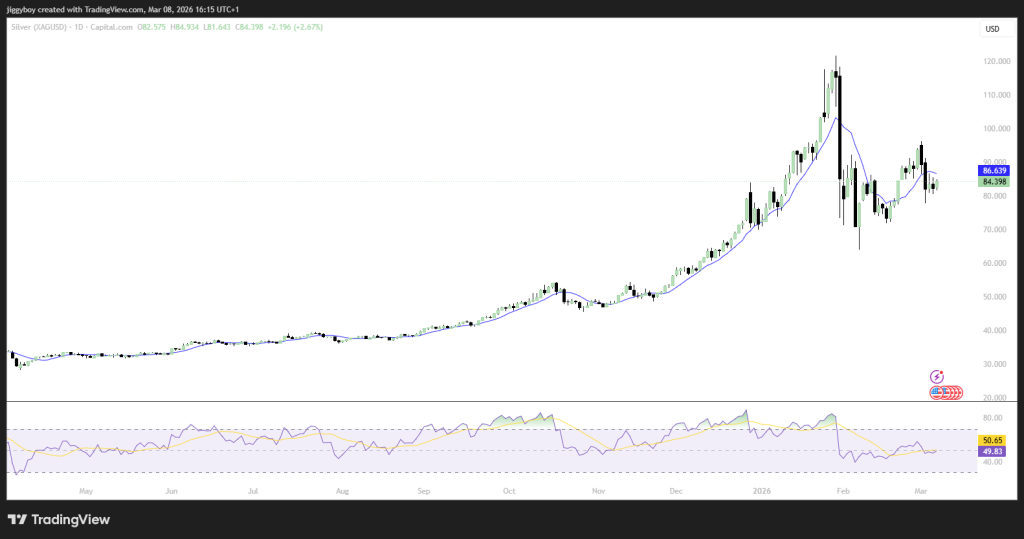
We took  a look at the daily chart and it shows the silver price has been climbing for most of the past year. The price slowly moved up from the $30–$40 range before the rally picked up speed late in 2025 and early 2026.

That surge eventually pushed the silver price above $110, but the market quickly pulled back. The drop happened fast but didn’t last long, trapping many sellers before buyers stepped back in.

Since then, silver has been moving sideways between roughly $78 and $90. This kind of pause often appears after a big rally as the market cools down and builds a new base.

Another thing standing out on the chart is the moving average line. Silver’s price climbed back above it, which often signals that the broader trend is still pointing upward.

Read Also: Gold Price Prediction: Analysts Say $5,380 Could Be the Next Stop

Source: TradingView.com

Momentum indicators also paint a similar picture. The RSI is trading at around 50 levels, indicating that the market is no longer overheated as it was during the recent rally above the $100 mark.

In January, the RSI remained trading in the overbought region for a longer period. Now it has cooled down, which often gives the market space to start another move if buyers return. All of this suggests silver is building a base after the last big rally.

Where Could the Silver Price Go This Week?

For the time being, the most important level seems to be the $80 level, which has been a good support level during the recent consolidation period. As long as the price holds above this level, the trend seems to be positive for the time being.

On the upside, the next hurdle sits around $90. The silver price has struggled there several times. If silver breaks above that level, the next level to watch is between $95 and $100, bringing the silver price close to the psychological level of $100.

If buying pressure continues to rise, especially if gold continues to rise or global tensions rise, silver may rise back into the $105 to $110 level, where the last major peak was formed.

On the downside, if the $80 support breaks, the price could slide toward $74–$76, which acted as a strong demand area during the February correction.

For now, the silver price is simply moving sideways after a huge rally, waiting to see whether buyers can push it toward the next breakout.

Subscribe to our YouTube channel for daily crypto updates, market insights, and expert analysis.

The post Here’s Where Silver Price Could Be Headed This Week appeared first on CaptainAltcoin.

Market Opportunity
WilderWorld Logo
WilderWorld Price(WILD)
$0.02264
$0.02264$0.02264
+1.47%
USD
WilderWorld (WILD) Live Price Chart
Disclaimer: The articles reposted on this site are sourced from public platforms and are provided for informational purposes only. They do not necessarily reflect the views of MEXC. All rights remain with the original authors. If you believe any content infringes on third-party rights, please contact crypto.news@mexc.com for removal. MEXC makes no guarantees regarding the accuracy, completeness, or timeliness of the content and is not responsible for any actions taken based on the information provided. The content does not constitute financial, legal, or other professional advice, nor should it be considered a recommendation or endorsement by MEXC.

You May Also Like

Litecoin Fluctuates Below The $116 Threshold

Litecoin Fluctuates Below The $116 Threshold

The post Litecoin Fluctuates Below The $116 Threshold appeared on BitcoinEthereumNews.com. Sep 17, 2025 at 23:05 // Price Litecoin price analysis by Coinidol.com: LTC price has slipped below the moving average lines after hitting resistance at $120. Litecoin price long-term prediction: bearish The 21-day SMA support helped to alleviate the selling pressure. In other words, the price of the cryptocurrency is above the 21-day SMA support but below the 50-day SMA barrier. This suggests that Litecoin will be trapped in a narrow range for a few days. If the 21-day SMA support or the 50-day SMA barrier is overreached, the cryptocurrency will trend upwards. For example, if the LTC price breaks through the 50-day SMA barrier, it will rise to a high of $124. Litecoin will fall to its current support level of $106 if the 21-day SMA support is broken. Technical Indicators  Resistance Levels: $100, $120, $140 Support Levels: $60, $40, $20 LTC price indicators analysis Litecoin’s price is squeezed between the moving average lines. It is unclear in which direction Litecoin will move. The moving average lines are horizontal in both charts. However, the price bars are limited to the distance between the moving averages. The price bars on the 4-hour chart are below the moving average lines. LTC/USD price chart – September 17, 2025 What is the next move for LTC? On the 4-hour chart, Litecoin is currently trading in a bearish trend zone. The altcoin is trading above the $112 support and below the moving average lines, which represent resistance at $116. The upward movement is hindered by the moving average lines, which are causing the price to oscillate within a limited range. Meanwhile, the signal for the cryptocurrency is bearish, with price bars below the moving average…
Share
BitcoinEthereumNews2025/09/18 08:15
XRP Price Watch: Price Action Tightens in Micro Range as Bulls Seek Control

XRP Price Watch: Price Action Tightens in Micro Range as Bulls Seek Control

The post XRP Price Watch: Price Action Tightens in Micro Range as Bulls Seek Control appeared on BitcoinEthereumNews.com. On Sunday, XRP is trading at $2.99 with a market capitalization of $178 billion and a 24-hour trading volume of $3.34 billion. The intraday price range sits narrowly between $2.97 and $3.01, suggesting a temporary equilibrium between buyers and sellers. XRP The 1-hour chart reflects a period of choppy, range-bound trading, typical of market indecision. […] Source: https://news.bitcoin.com/xrp-price-watch-price-action-tightens-in-micro-range-as-bulls-seek-control/
Share
BitcoinEthereumNews2025/09/21 22:41
River Token Plunges 20.8% in 24 Hours: On-Chain Data Reveals Pressure Points

River Token Plunges 20.8% in 24 Hours: On-Chain Data Reveals Pressure Points

River (RIVER) experienced a sharp 20.8% decline to $12.35 within 24 hours, erasing $64 million in market capitalization. Our data analysis reveals concerning volume
Share
Blockchainmagazine2026/03/09 18:04