TLDR SOL hit a low of $80.29 after falling below key support levels at $88 and $85 A bearish trend line sits at $85.50, acting as immediate resistance on the hourlyTLDR SOL hit a low of $80.29 after falling below key support levels at $88 and $85 A bearish trend line sits at $85.50, acting as immediate resistance on the hourly

Solana (SOL) Price: $80 Support Is Holding — Here’s What the Charts Say

2026/03/09 16:23
3 min read
For feedback or concerns regarding this content, please contact us at crypto.news@mexc.com

TLDR

  • SOL hit a low of $80.29 after falling below key support levels at $88 and $85
  • A bearish trend line sits at $85.50, acting as immediate resistance on the hourly chart
  • Solana ETFs recorded $24 million in net inflows last week, but ended with two days of outflows
  • Open Interest rose 1% to $5.01 billion, but $15.52 million in long positions were liquidated in 24 hours
  • Solana has overtaken Ethereum in RWA wallet count, but Ethereum still holds $15.5 billion vs SOL’s $1.8 billion in tokenized assets

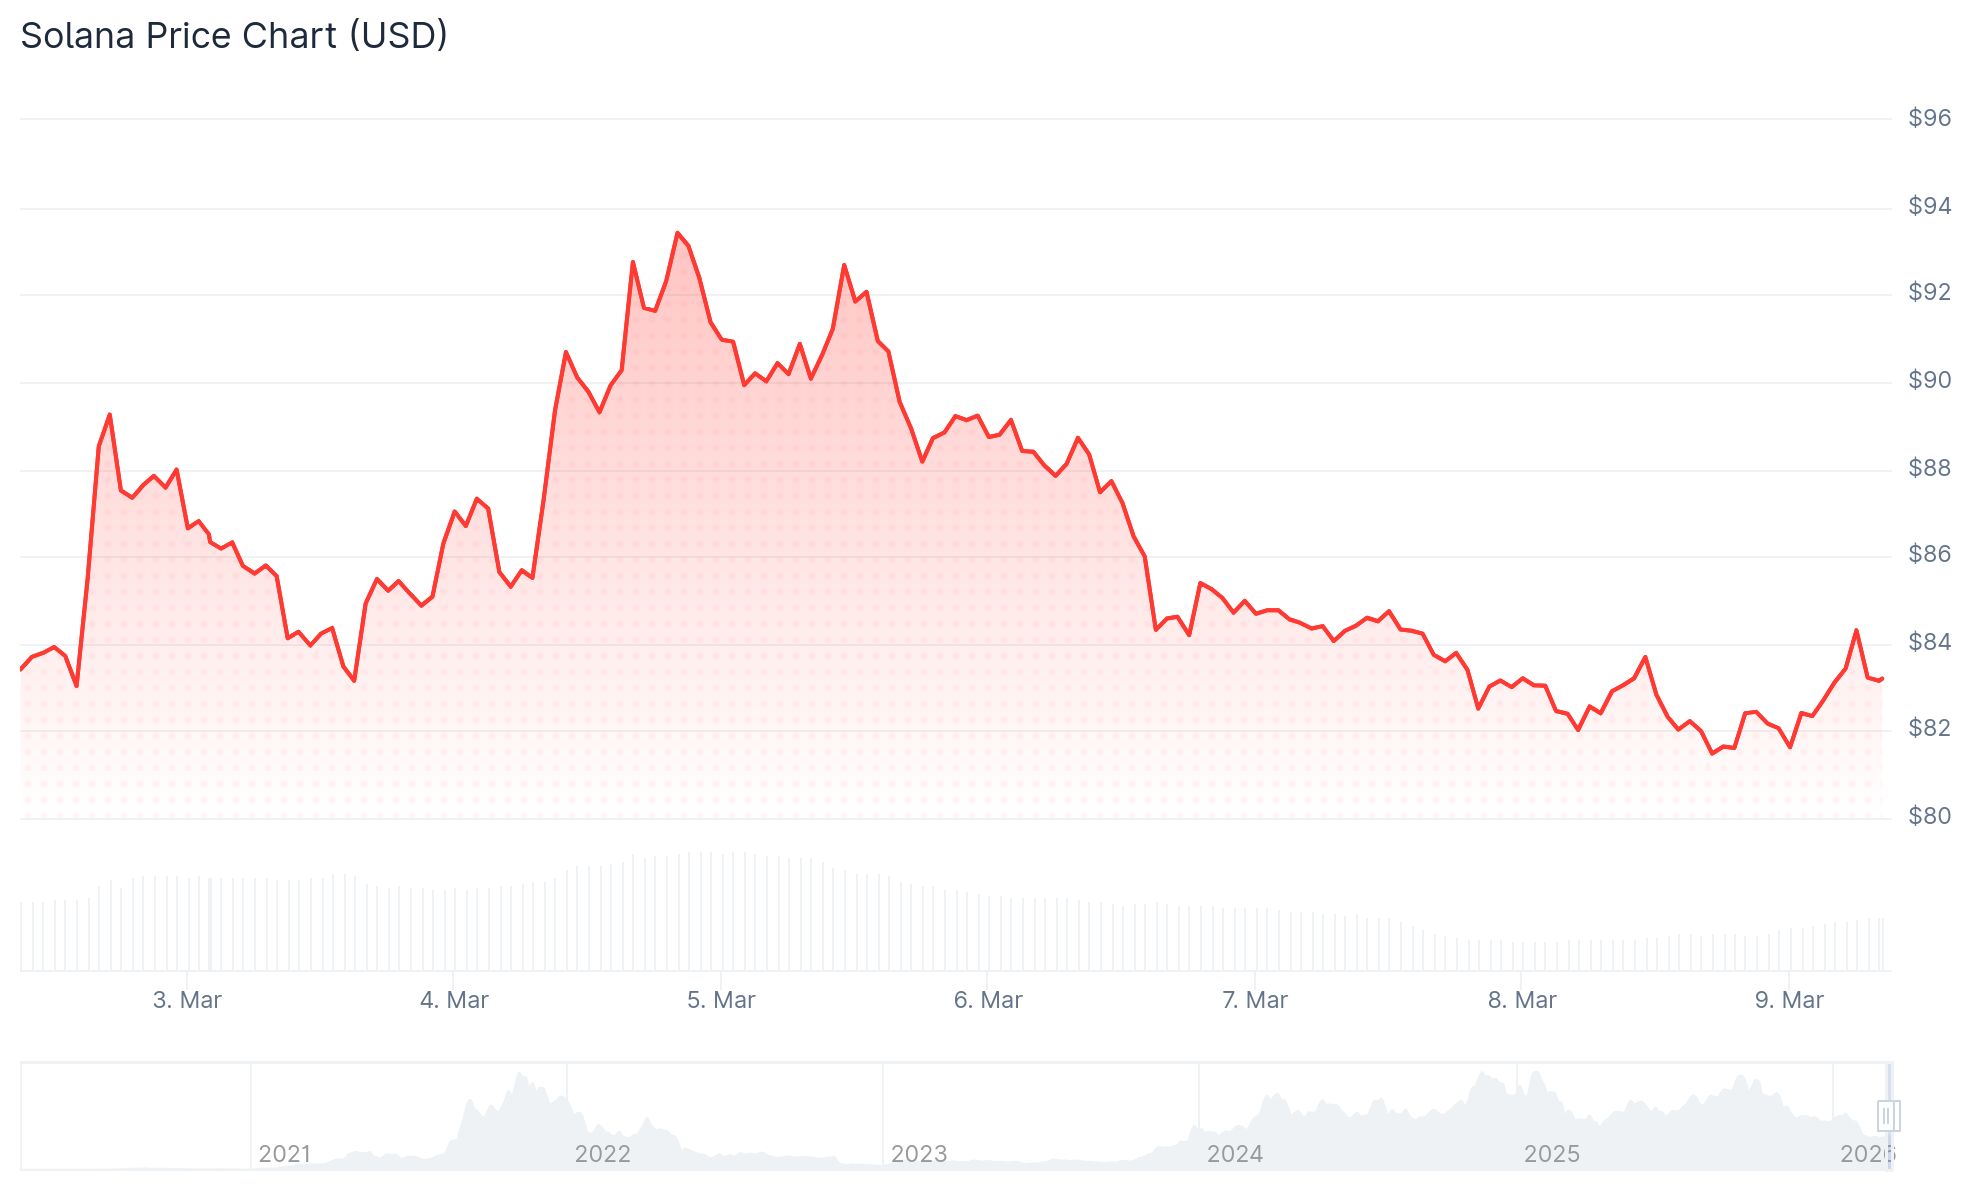
Solana fell sharply over the past week, dropping to a low of $80.29 before staging a small bounce. The price remains below $85 and the 100-hour simple moving average at the time of writing.

Solana (SOL) PriceSolana (SOL) Price

The drop followed a failure to hold above $90. SOL broke through the $88 and $85 support levels before hitting its recent floor near $80.

A bearish trend line now sits at $85.50 on the hourly chart. This is acting as the main short-term resistance. The 50% Fibonacci retracement of the recent decline sits at $87.20, with stronger resistance at $88.80.

If SOL breaks back above $88.80, the next targets would be $95 and potentially $102. If it falls below $80, the next support zones are $72 and then $65.

On Monday, SOL recovered around 2% after four straight days of losses. However, the broader trend remains bearish. The coin trades below its 50-, 100-, and 200-day EMAs.

The RSI sits at 43, below the neutral 50 midline. The MACD histogram is contracting, pointing to fading bullish momentum.

Solana ETF Flows Show Mixed Signals

US spot Solana ETFs currently hold around $800 million in SOL. Cumulative net inflows stand at $957 million as of Friday, showing institutional holders largely stayed put during the recent price drop.

Source: SoSoValue

Last week’s net inflow was $24 million. But the final two days of the week saw outflows of $5.23 million and $8.23 million respectively.

Analysts link the late-week outflows to broader market pressure tied to rising oil prices and geopolitical tensions.

Open Interest in SOL derivatives rose 1% in 24 hours to $5.01 billion. The funding rate improved from -0.0161% to -0.0006%, showing reduced bearish pressure from traders.

Still, $19.79 million in positions were liquidated in the same period. Of that, $15.52 million came from long positions being wiped out.

Solana Passes Ethereum in RWA Wallet Count

Solana has reached 154,942 wallets holding tokenized real-world assets, passing Ethereum’s 153,592. This is the first time Solana has led Ethereum in this metric.

The growth is driven largely by retail traders buying tokenized shares of companies like Tesla and Nvidia through Solana’s low-fee network.

Ethereum, however, still holds $15.5 billion in tokenized RWA value versus Solana’s $1.8 billion. Ethereum also supports 663 tokenization projects compared to Solana’s 345.

BlackRock and Fidelity use Ethereum for products like tokenized Treasury bills and money market funds. Solana has secured some institutional deployments from BlackRock, but remains primarily retail-driven in the RWA space.

SOL’s initial support level sits at $78.35, the last key floor before $67.50, marked by the February 6 low.

The post Solana (SOL) Price: $80 Support Is Holding — Here’s What the Charts Say appeared first on CoinCentral.

Market Opportunity
Solana Logo
Solana Price(SOL)
$83.82
$83.82$83.82
+2.13%
USD
Solana (SOL) Live Price Chart
Disclaimer: The articles reposted on this site are sourced from public platforms and are provided for informational purposes only. They do not necessarily reflect the views of MEXC. All rights remain with the original authors. If you believe any content infringes on third-party rights, please contact crypto.news@mexc.com for removal. MEXC makes no guarantees regarding the accuracy, completeness, or timeliness of the content and is not responsible for any actions taken based on the information provided. The content does not constitute financial, legal, or other professional advice, nor should it be considered a recommendation or endorsement by MEXC.

You May Also Like

Litecoin Fluctuates Below The $116 Threshold

Litecoin Fluctuates Below The $116 Threshold

The post Litecoin Fluctuates Below The $116 Threshold appeared on BitcoinEthereumNews.com. Sep 17, 2025 at 23:05 // Price Litecoin price analysis by Coinidol.com: LTC price has slipped below the moving average lines after hitting resistance at $120. Litecoin price long-term prediction: bearish The 21-day SMA support helped to alleviate the selling pressure. In other words, the price of the cryptocurrency is above the 21-day SMA support but below the 50-day SMA barrier. This suggests that Litecoin will be trapped in a narrow range for a few days. If the 21-day SMA support or the 50-day SMA barrier is overreached, the cryptocurrency will trend upwards. For example, if the LTC price breaks through the 50-day SMA barrier, it will rise to a high of $124. Litecoin will fall to its current support level of $106 if the 21-day SMA support is broken. Technical Indicators  Resistance Levels: $100, $120, $140 Support Levels: $60, $40, $20 LTC price indicators analysis Litecoin’s price is squeezed between the moving average lines. It is unclear in which direction Litecoin will move. The moving average lines are horizontal in both charts. However, the price bars are limited to the distance between the moving averages. The price bars on the 4-hour chart are below the moving average lines. LTC/USD price chart – September 17, 2025 What is the next move for LTC? On the 4-hour chart, Litecoin is currently trading in a bearish trend zone. The altcoin is trading above the $112 support and below the moving average lines, which represent resistance at $116. The upward movement is hindered by the moving average lines, which are causing the price to oscillate within a limited range. Meanwhile, the signal for the cryptocurrency is bearish, with price bars below the moving average…
Share
BitcoinEthereumNews2025/09/18 08:15
XRP Price Watch: Price Action Tightens in Micro Range as Bulls Seek Control

XRP Price Watch: Price Action Tightens in Micro Range as Bulls Seek Control

The post XRP Price Watch: Price Action Tightens in Micro Range as Bulls Seek Control appeared on BitcoinEthereumNews.com. On Sunday, XRP is trading at $2.99 with a market capitalization of $178 billion and a 24-hour trading volume of $3.34 billion. The intraday price range sits narrowly between $2.97 and $3.01, suggesting a temporary equilibrium between buyers and sellers. XRP The 1-hour chart reflects a period of choppy, range-bound trading, typical of market indecision. […] Source: https://news.bitcoin.com/xrp-price-watch-price-action-tightens-in-micro-range-as-bulls-seek-control/
Share
BitcoinEthereumNews2025/09/21 22:41
River Token Plunges 20.8% in 24 Hours: On-Chain Data Reveals Pressure Points

River Token Plunges 20.8% in 24 Hours: On-Chain Data Reveals Pressure Points

River (RIVER) experienced a sharp 20.8% decline to $12.35 within 24 hours, erasing $64 million in market capitalization. Our data analysis reveals concerning volume
Share
Blockchainmagazine2026/03/09 18:04