

Here’s why Shiba Inu Coin price is on the cusp of a rebound
Shiba Inu Coin price rose by 7% on March 10 as the crypto market rallied and as the burn rate jumped by over 162%.
- Shiba Inu price rose by over 7% on Tuesday as crypto prices rebounded.
- The coin’s burn rate jumped by 162% to 6.5 million.
- It has formed a highly bullish falling wedge pattern, pointing to an eventual rebound.
Shiba Inu (SHIB) token was trading at $0.0000058, a few points slightly above the year-to-date low of $0.00000525. It remains 83% below its highest point in 2025.
On the positive side, the coin’s burn rate jumped by 162% to over 6.58 million in the last 24 hours. The circulating supply has dropped to 585 billion after 410 billion were burned from the initial supply. A token burn reduces a coin’s circulating supply and its inflation.
Meanwhile, futures data shows that activity in the market is doing well. The futures open interest rose to $62.8 million on Wednesday, up sharply from last week’s low of $53 million. Rising open interest is a sign that demand is rising in the futures market.
Shiba Inu’s volume in the spot market has also continued rising this week. It jumped to over $143 million, up from below $100 million last week.
Another potential catalyst for the token is the latest developments in the Middle East, where Donald Trump is seeking to de-escalate the crisis after the stock market dropped and crude oil prices surged to the highest point since 2022.
Shiba Inu Coin price technical analysis
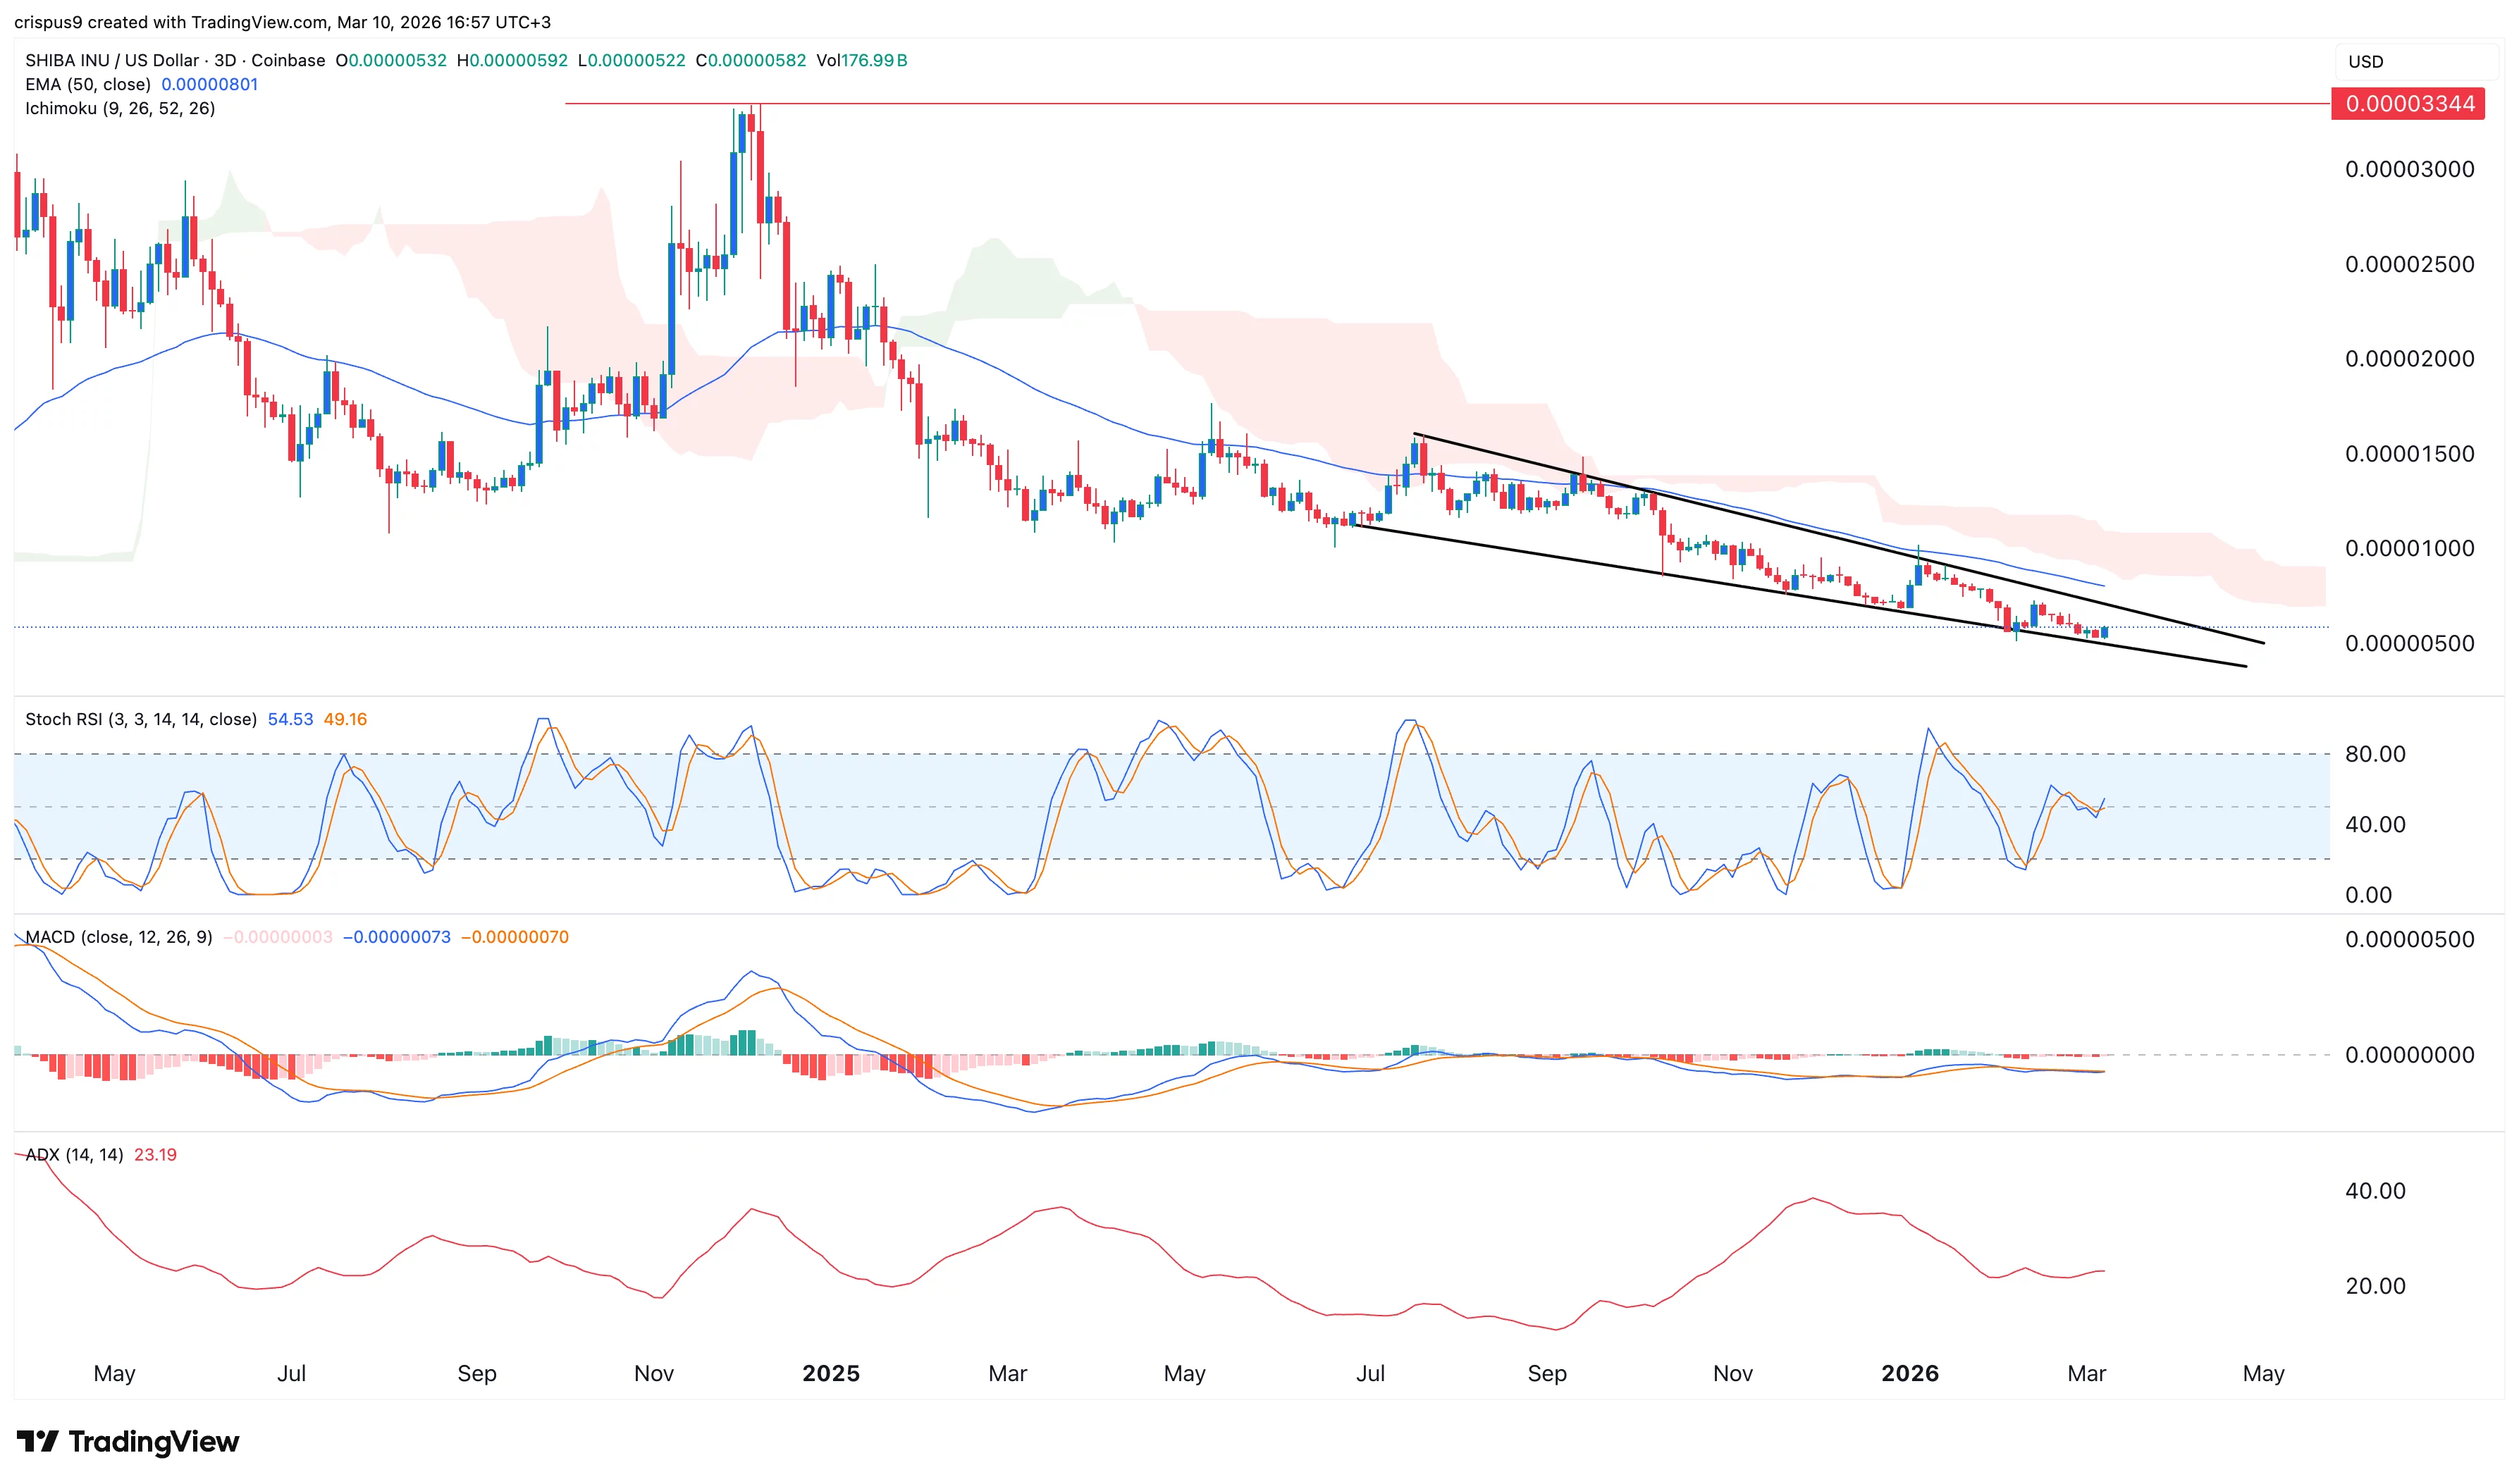
A look at the three-day chart shows that the coin has remained in a bear market this year. This decline, however, is losing momentum as evidenced by the Average Directional Index, which has moved sideways since January.
On the positive side, the coin has formed a large falling wedge pattern, which is made up of two descending and converging trendlines. There are signs that the two lines are nearing their confluence, which is where bullish breakouts normally happens.
At the same time, the Stochastic Relative Strength Index has moved upwards from 20 in January to 55 today. That is a sign that it has formed a bullish divergence pattern.
Therefore, the most likely SHIB price prediction is bullish, with the next key target being at the 50-day Exponential Moving Average level at $0.0000080. The bullish view will become invalid if it drops below the year-to-date low.


You May Also Like

Analyst Says XRP Looks Ready for a Massive Breakout. Here’s the Signal

Alphabet (GOOGL) Stock Nears $5 Trillion Market Cap Ahead of Google I/O Tuesday


