Dogecoin (DOGE) is gaining momentum after a sharp 7% daily surge by ETF speculation, aggressive buying by whales, and supportive technical levels. With the price surging up to $0.2802 and the market cap at $42.29 billion, the technical analyst sets a target for a breakout above $0.30 capable of inducing further upside. Dogecoin is back […]Dogecoin (DOGE) is gaining momentum after a sharp 7% daily surge by ETF speculation, aggressive buying by whales, and supportive technical levels. With the price surging up to $0.2802 and the market cap at $42.29 billion, the technical analyst sets a target for a breakout above $0.30 capable of inducing further upside. Dogecoin is back […]

Dogecoin Price Forecast: Explosive Rally Toward $1 by Year-End

Dogecoin
  • Dogecoin jumped 7.14% to $0.2802, pushing the market cap to $42.29 billion amidst ETF hopes.
  • The whales accumulated 280 million DOGE within 24 hours, confirming breakout potential beyond $0.30 resistance.
  • DOGE derivatives surged, with open interest up 12.11% to $5.39B, trading volume hitting $9.96B.

Dogecoin (DOGE) is gaining momentum after a sharp 7% daily surge by ETF speculation, aggressive buying by whales, and supportive technical levels. With the price surging up to $0.2802 and the market cap at $42.29 billion, the technical analyst sets a target for a breakout above $0.30 capable of inducing further upside.

Dogecoin is back in the limelight after a 7.14% increase in the previous 24 hours propelling the price at $0.2802 and the market cap at $42.29 billion. The price increase was a result of various catalysts including ETF speculation, whale movements, and surging analyst enthusiasm.

Source: CoinMarketCap

Dogecoin ETF Anticipation Drives Market Surge

One of the major drivers behind this rise is rising hopes for a Dogecoin ETF, which has sparked excitement across the market. The recent post suggests approval could come in the near term and this speculation alone has lifted DOGE up by more than 6% in a day.

Source: X

Fueling the rally further, whale wallets have been very active. In the last 24 hours alone, 280 million DOGE coins were accumulated, indicating fresh belief from major investors. The accumulation has solidified conviction that Dogecoin is about to make a major breakout.

Dogecoin Faces Resistance Between $0.274–$0.29

Technically, DOGE is now faced with resistance at the $0.274 and $0.29 area. Analyst Surf is predicting a year-end target of $1. He locations the primary level at the 0.618 Fibonacci retracement at about $0.29. A break above this should see the price increase towards $0.43 and then $1.08.

Source: X

Despite the optimism, caution remains essential. Analysts highlight that $0.26 is a strong support line. Should this level break down, the current pace may slow and short-term volatilities ensue.

Overall, DOGE is showing new strength as the attention stays centered around prospective ETF approval and mass-scale accumulation. In the short term, the meme coin is becoming one of the closely-observed assets in the universe, and the goal stays the $0.30 breakout level.

Also Read | DOGE Price Prediction: Will Dogecoin Break $0.50 Soon?

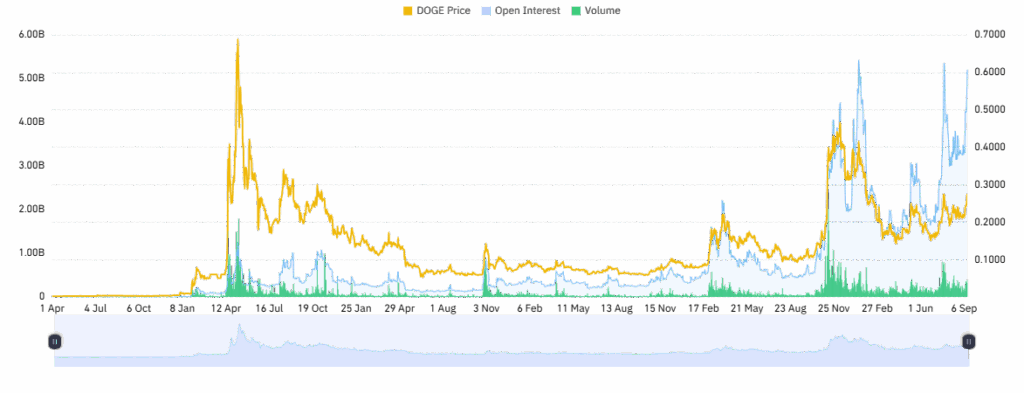
Dogecoin Derivatives See Strong Growth in Open Interest

Dogecoin derivatives also reflect this strength, with open interest rose 12.11% to $5.39 billion. Trading volume also followed suit, surging 13.60% to $9.96 billion. These surges indicate strong participation by long and short investors and the growing interest as the price volatility gets firmer across the DOGE market.

Source: CoinGlass

Meanwhile, the OI-Weighted ratio is 0.0113%. This is a relatively modest reading, and it reflects stable positioning and controlled leverage. While not extreme, it shows strong participation by investors. With liquidity and demand recovering, the Dogecoin derivatives market of Dogecoin looks more sustainable as investment activity continues to go up.

Source: CoinGlass

Also Read | Will XRP Reclaim a Top 5 Spot by End of 2025? Market Analysts Weigh In

Market Opportunity
Capverse Logo
Capverse Price(CAP)
$0.12785
$0.12785$0.12785
-1.41%
USD
Capverse (CAP) Live Price Chart
Disclaimer: The articles reposted on this site are sourced from public platforms and are provided for informational purposes only. They do not necessarily reflect the views of MEXC. All rights remain with the original authors. If you believe any content infringes on third-party rights, please contact service@support.mexc.com for removal. MEXC makes no guarantees regarding the accuracy, completeness, or timeliness of the content and is not responsible for any actions taken based on the information provided. The content does not constitute financial, legal, or other professional advice, nor should it be considered a recommendation or endorsement by MEXC.

You May Also Like

Robinhood’s New Move: MNT Coin Joins the Roster

Robinhood’s New Move: MNT Coin Joins the Roster

Bitcoin continues to hover beneath the $91,000 threshold, but the crypto domain isn’t stagnating. Cryptocurrency platforms are vigorously expanding their altcoin
Share
Coinstats2026/01/20 21:48
Microsoft Corp. $MSFT blue box area offers a buying opportunity

Microsoft Corp. $MSFT blue box area offers a buying opportunity

The post Microsoft Corp. $MSFT blue box area offers a buying opportunity appeared on BitcoinEthereumNews.com. In today’s article, we’ll examine the recent performance of Microsoft Corp. ($MSFT) through the lens of Elliott Wave Theory. We’ll review how the rally from the April 07, 2025 low unfolded as a 5-wave impulse followed by a 3-swing correction (ABC) and discuss our forecast for the next move. Let’s dive into the structure and expectations for this stock. Five wave impulse structure + ABC + WXY correction $MSFT 8H Elliott Wave chart 9.04.2025 In the 8-hour Elliott Wave count from Sep 04, 2025, we saw that $MSFT completed a 5-wave impulsive cycle at red III. As expected, this initial wave prompted a pullback. We anticipated this pullback to unfold in 3 swings and find buyers in the equal legs area between $497.02 and $471.06 This setup aligns with a typical Elliott Wave correction pattern (ABC), in which the market pauses briefly before resuming its primary trend. $MSFT 8H Elliott Wave chart 7.14.2025 The update, 10 days later, shows the stock finding support from the equal legs area as predicted allowing traders to get risk free. The stock is expected to bounce towards 525 – 532 before deciding if the bounce is a connector or the next leg higher. A break into new ATHs will confirm the latter and can see it trade higher towards 570 – 593 area. Until then, traders should get risk free and protect their capital in case of a WXY double correction. Conclusion In conclusion, our Elliott Wave analysis of Microsoft Corp. ($MSFT) suggested that it remains supported against April 07, 2025 lows and bounce from the blue box area. In the meantime, keep an eye out for any corrective pullbacks that may offer entry opportunities. By applying Elliott Wave Theory, traders can better anticipate the structure of upcoming moves and enhance risk management in volatile markets. Source: https://www.fxstreet.com/news/microsoft-corp-msft-blue-box-area-offers-a-buying-opportunity-202509171323
Share
BitcoinEthereumNews2025/09/18 03:50
Robinhood Crypto has listed the MNT token.

Robinhood Crypto has listed the MNT token.

PANews reported on January 20 that Robinhood announced on its X platform that the MNT token is now available for trading on Robinhood Crypto, including in the New
Share
PANews2026/01/20 22:02