Bitcoin (BTC) treasury companies are facing a rather critical situation as their market premium over underlying BTC holdings erodes amid falling volatility and a sharp slowdown in new purchases. Notably, monthly BTC purchases by these companies have crashed by 97% since November 2024, reflecting a highly cautious market approach in recent months. However, recent data […]Bitcoin (BTC) treasury companies are facing a rather critical situation as their market premium over underlying BTC holdings erodes amid falling volatility and a sharp slowdown in new purchases. Notably, monthly BTC purchases by these companies have crashed by 97% since November 2024, reflecting a highly cautious market approach in recent months. However, recent data […]

Bitcoin Treasury Premium At Risk — What Could This Mean For BTC Price?

Bitcoin (BTC) treasury companies are facing a rather critical situation as their market premium over underlying BTC holdings erodes amid falling volatility and a sharp slowdown in new purchases. Notably, monthly BTC purchases by these companies have crashed by 97% since November 2024, reflecting a highly cautious market approach in recent months. However, recent data from CryptoQuant suggests the need for an immediate change in strategy.

Falling Bitcoin Volatility Threatens Bitcoin Treasuries Market Value

Generally, Bitcoin treasuries trade at a premium, meaning their market value exceeds the actual worth of the BTC they hold, as investors believe these companies can grow their holdings, monetize volatility, and act as a safe exposure to the premier cryptocurrency. Therefore, the market net asset value (mNAV), which compares these companies’ share price to the NAV of their Bitcoin holdings, is always greater than 1. However, CryptoQuant Head of Research, Julio Moreno, shares that annualized Bitcoin volatility has fallen to multi-year lows, removing a key driver of that premium as treasuries have fewer opportunities to capitalize on price swings and justify valuations above their underlying BTC holdings.


Bitcoin

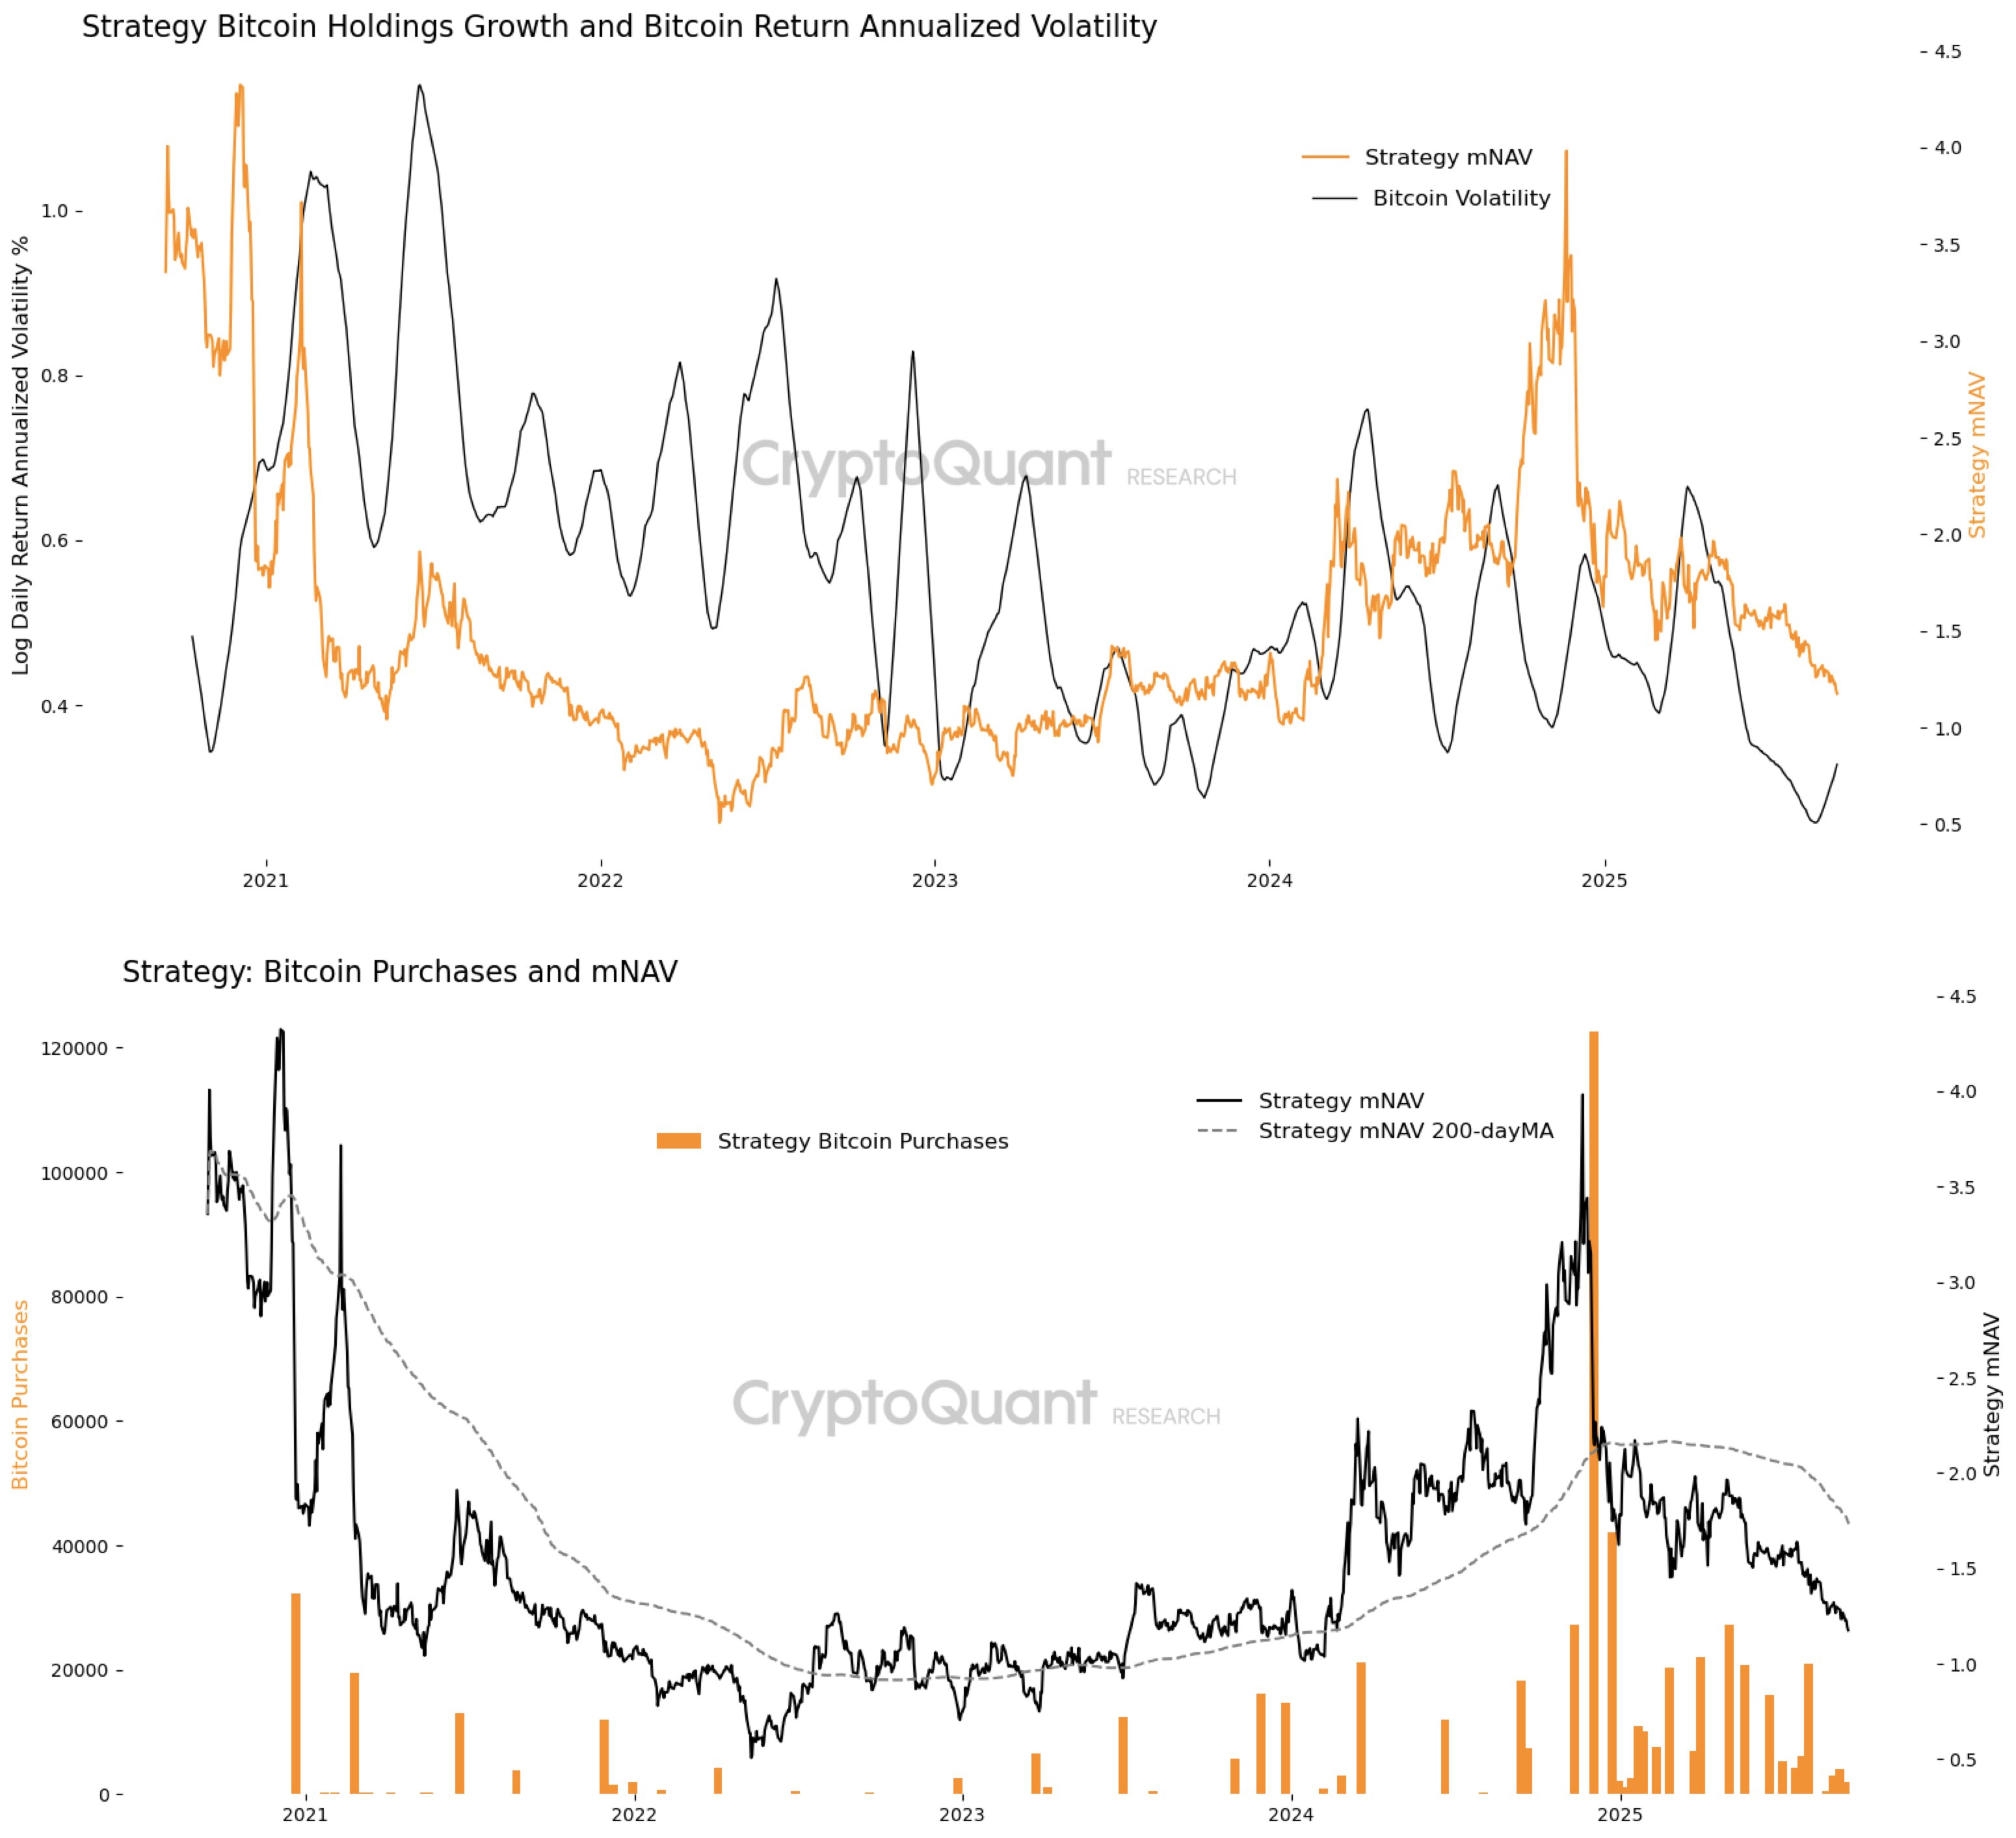
In analyzing market data for Strategy, the largest corporate BTC holder, it can be observed that certain spikes in volatility have produced periods when the mNAV surged above 2.0, most notably in early 2021 and again in mid-2024. During these windows, treasury companies were able to monetize volatility, raising equity or debt at a premium and deploying those proceeds into rapid BTC purchases.

Currently, however, volatility has compressed far below 0.4 log daily return annualized, reaching its lowest level since 2020. The flattening volatility curve has coincided with a steady decline in mNAV, which has slipped back toward 1.25. This narrowing premium suggests investors no longer see treasury companies as offering meaningful leverage over simply holding Bitcoin directly.

Related Reading: Tether Announces US Stablecoin Launch, Appoints Ex-Trump Advisor As CEO

Weakening Demand Compounds Treasuries’ Problem

Without the “fuel” of price swings, Bitcoin treasury firms struggle to expand their holdings in ways that justify a premium valuation. While there were isolated bursts of buying in late 2024 and early 2025, overall activity remains muted. Correspondingly, Strategy’s mNAV has been trending downward since the turn of 2025, even as BTC itself has traded in a relatively elevated price range compared to recent years. The data suggests that when treasuries buy aggressively, investor enthusiasm pushes mNAV higher, reinforcing the cycle of premium issuance and BTC accumulation. Julio Moreno explains that for the mNAV premium to persist, a rebound in BTC volatility and renewed demand through large-scale purchases are immediately needed. Until then, treasury companies may find it increasingly difficult to justify valuations above their Bitcoin net asset value, forcing investors to consider a direct exposure to Bitcoin for returns rather than on corporate strategy. At press time, Bitcoin trades at $115,810, reflecting a 4.72% gain in the past week.

Bitcoin
Market Opportunity
Bitcoin Logo
Bitcoin Price(BTC)
$90,430.31
$90,430.31$90,430.31
-2.83%
USD
Bitcoin (BTC) Live Price Chart
Disclaimer: The articles reposted on this site are sourced from public platforms and are provided for informational purposes only. They do not necessarily reflect the views of MEXC. All rights remain with the original authors. If you believe any content infringes on third-party rights, please contact service@support.mexc.com for removal. MEXC makes no guarantees regarding the accuracy, completeness, or timeliness of the content and is not responsible for any actions taken based on the information provided. The content does not constitute financial, legal, or other professional advice, nor should it be considered a recommendation or endorsement by MEXC.

You May Also Like

Robinhood’s New Move: MNT Coin Joins the Roster

Robinhood’s New Move: MNT Coin Joins the Roster

Bitcoin continues to hover beneath the $91,000 threshold, but the crypto domain isn’t stagnating. Cryptocurrency platforms are vigorously expanding their altcoin
Share
Coinstats2026/01/20 21:48
Microsoft Corp. $MSFT blue box area offers a buying opportunity

Microsoft Corp. $MSFT blue box area offers a buying opportunity

The post Microsoft Corp. $MSFT blue box area offers a buying opportunity appeared on BitcoinEthereumNews.com. In today’s article, we’ll examine the recent performance of Microsoft Corp. ($MSFT) through the lens of Elliott Wave Theory. We’ll review how the rally from the April 07, 2025 low unfolded as a 5-wave impulse followed by a 3-swing correction (ABC) and discuss our forecast for the next move. Let’s dive into the structure and expectations for this stock. Five wave impulse structure + ABC + WXY correction $MSFT 8H Elliott Wave chart 9.04.2025 In the 8-hour Elliott Wave count from Sep 04, 2025, we saw that $MSFT completed a 5-wave impulsive cycle at red III. As expected, this initial wave prompted a pullback. We anticipated this pullback to unfold in 3 swings and find buyers in the equal legs area between $497.02 and $471.06 This setup aligns with a typical Elliott Wave correction pattern (ABC), in which the market pauses briefly before resuming its primary trend. $MSFT 8H Elliott Wave chart 7.14.2025 The update, 10 days later, shows the stock finding support from the equal legs area as predicted allowing traders to get risk free. The stock is expected to bounce towards 525 – 532 before deciding if the bounce is a connector or the next leg higher. A break into new ATHs will confirm the latter and can see it trade higher towards 570 – 593 area. Until then, traders should get risk free and protect their capital in case of a WXY double correction. Conclusion In conclusion, our Elliott Wave analysis of Microsoft Corp. ($MSFT) suggested that it remains supported against April 07, 2025 lows and bounce from the blue box area. In the meantime, keep an eye out for any corrective pullbacks that may offer entry opportunities. By applying Elliott Wave Theory, traders can better anticipate the structure of upcoming moves and enhance risk management in volatile markets. Source: https://www.fxstreet.com/news/microsoft-corp-msft-blue-box-area-offers-a-buying-opportunity-202509171323
Share
BitcoinEthereumNews2025/09/18 03:50
Robinhood Crypto has listed the MNT token.

Robinhood Crypto has listed the MNT token.

PANews reported on January 20 that Robinhood announced on its X platform that the MNT token is now available for trading on Robinhood Crypto, including in the New
Share
PANews2026/01/20 22:02