Ethereum has finally shaken off weeks of sideways movement, launching into a strong rally. The asset now sits at a decisive resistance band that will determine whether this breakout extends into a larger trend continuation or fades into another consolidation. Technical Analysis By Shayan The Daily Chart On the daily chart, Ethereum continues to respect […]Ethereum has finally shaken off weeks of sideways movement, launching into a strong rally. The asset now sits at a decisive resistance band that will determine whether this breakout extends into a larger trend continuation or fades into another consolidation. Technical Analysis By Shayan The Daily Chart On the daily chart, Ethereum continues to respect […]

Ethereum Price Analysis: Is $5K Inevitable as ETH Finally Breaks Out?

Ethereum has finally shaken off weeks of sideways movement, launching into a strong rally. The asset now sits at a decisive resistance band that will determine whether this breakout extends into a larger trend continuation or fades into another consolidation.

Technical Analysis

By Shayan

The Daily Chart

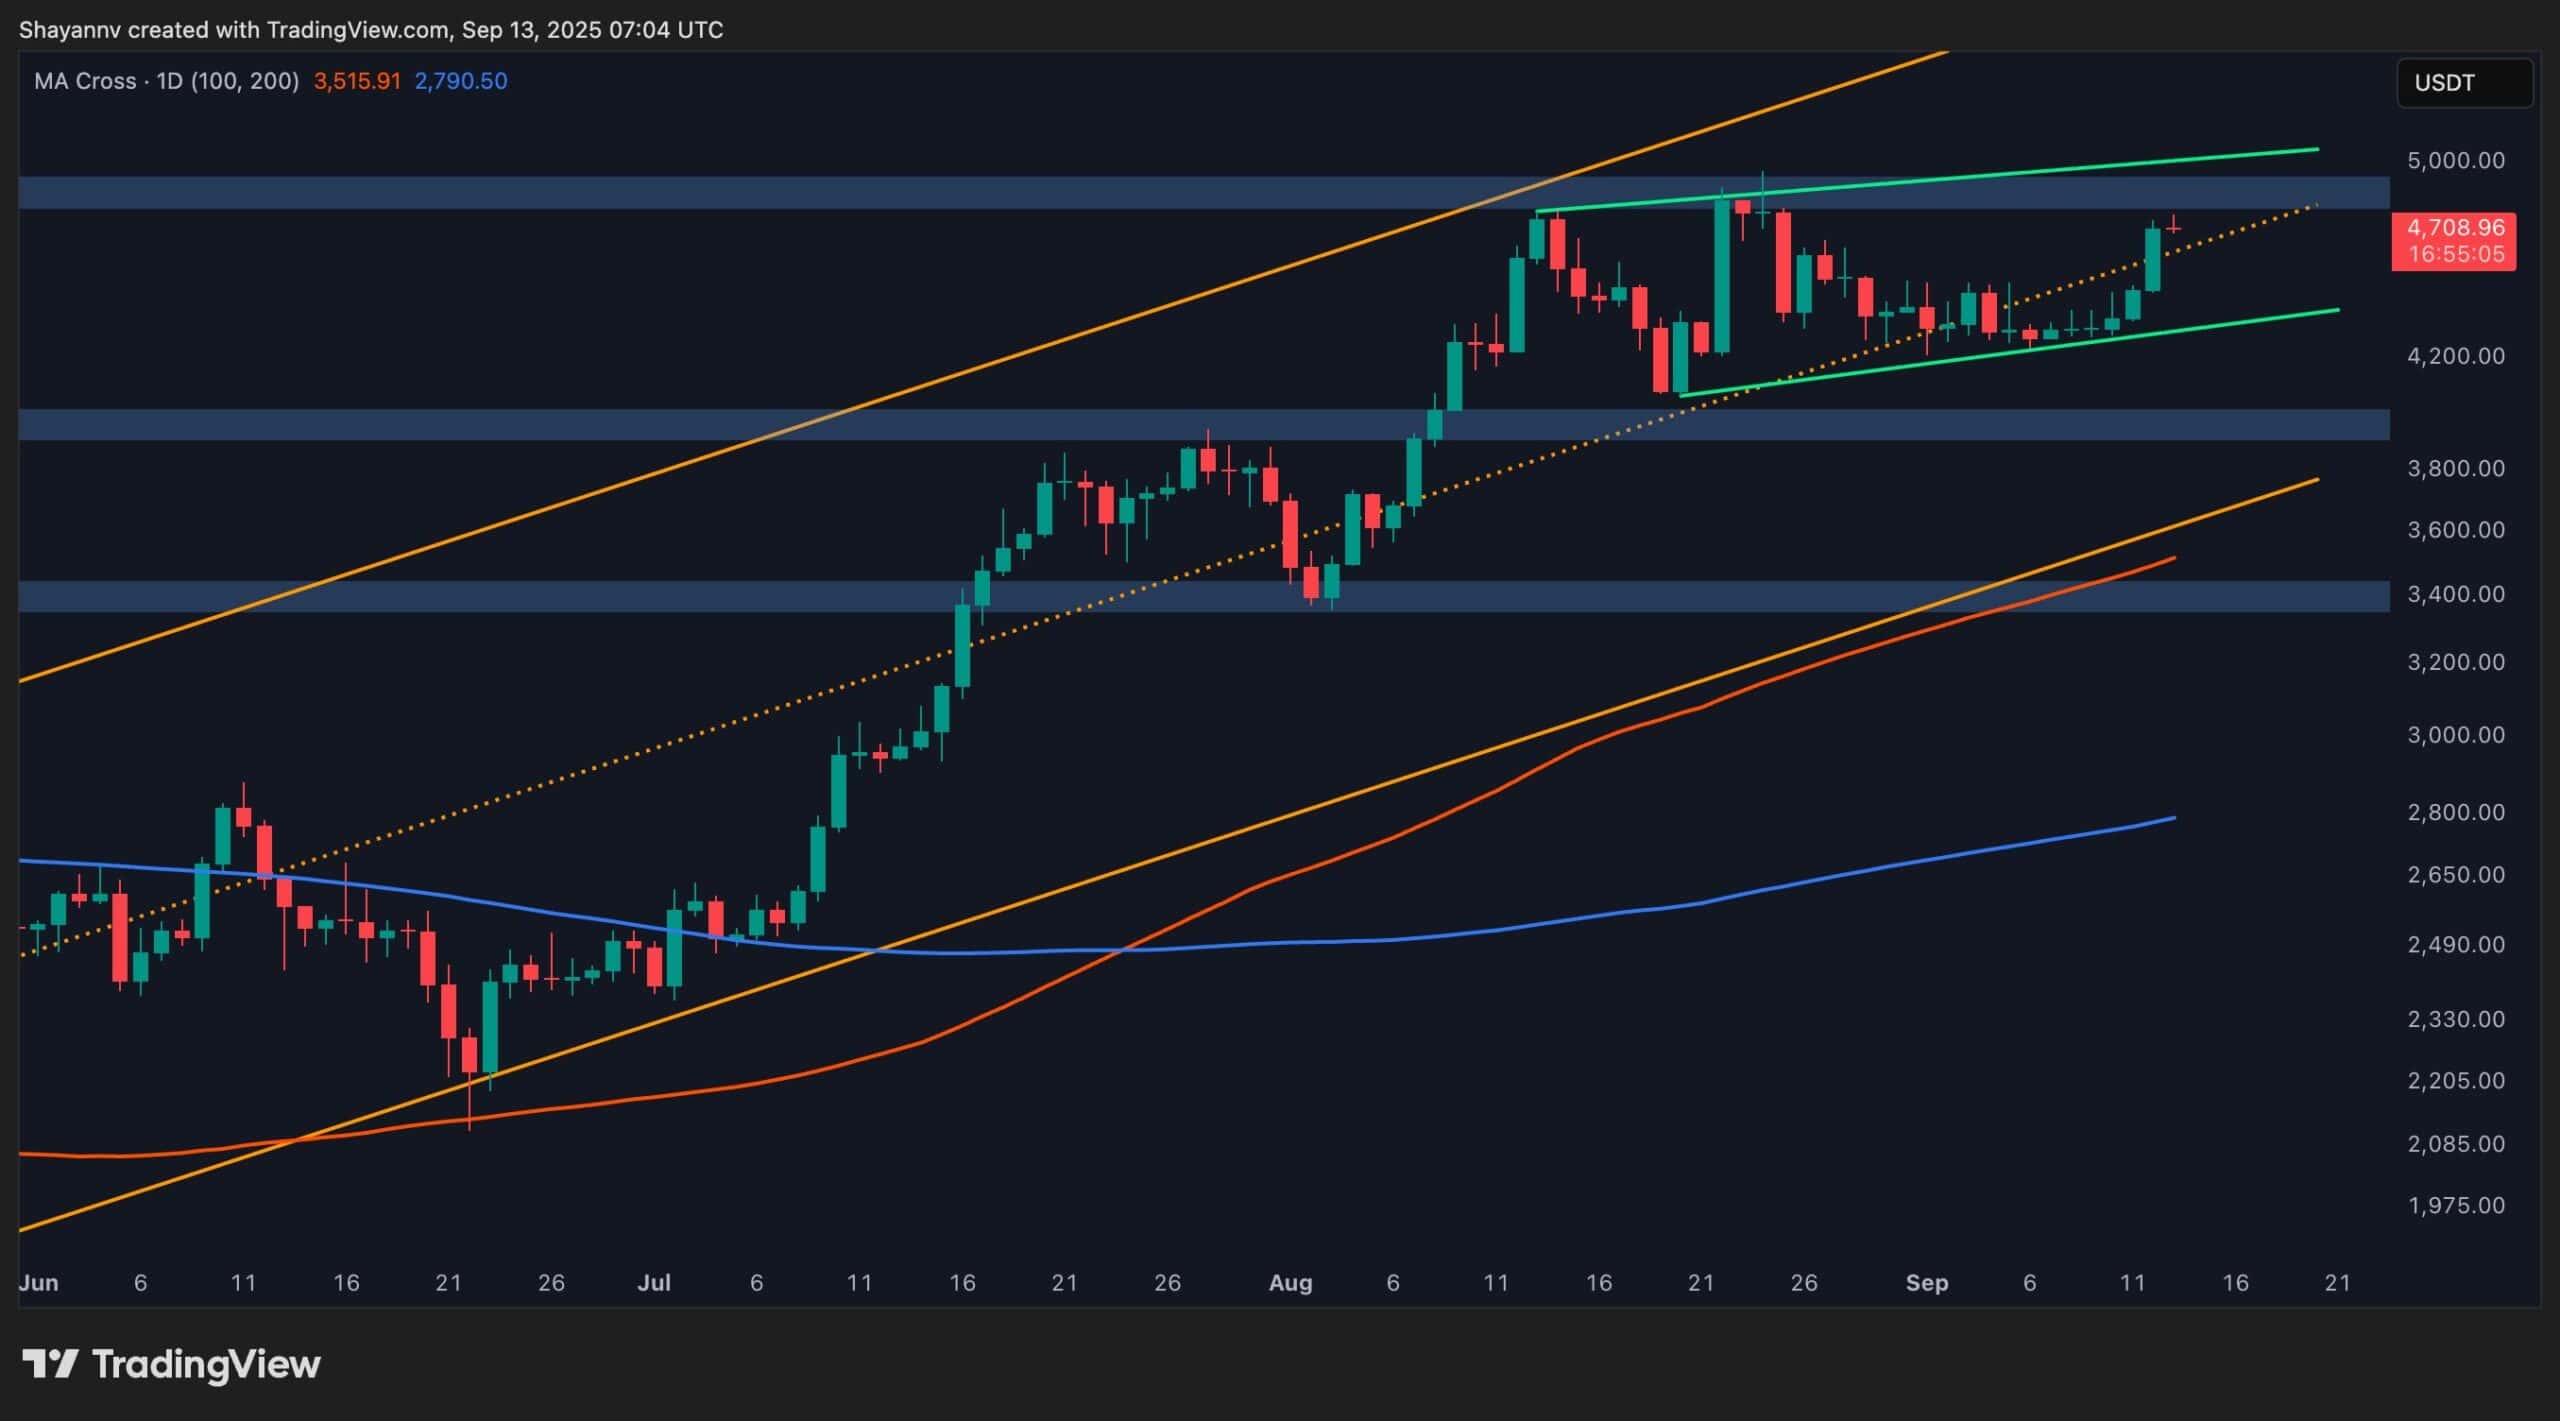
On the daily chart, Ethereum continues to respect its broad ascending channel, with the latest surge carrying price directly into the $4.7K–$4.8K supply zone. This region has acted as a ceiling before, and its overlap with the upper channel boundary amplifies its importance.

A confirmed daily close above this barrier would significantly increase the probability of a retest of the $5K threshold. However, rejection here could trigger a cooling phase back toward the mid-channel zone around $4.4K–$4.2K, an area reinforced by trendline structure and key support for bulls to defend.

The 4-Hour Chart

On the 4-hour chart, Ethereum broke out of its wedge formation with an impulsive rally, driving straight into the $4.7K resistance band. While momentum remains with buyers, the current stall highlights the presence of short-term supply.

From here, Ethereum faces a clear crossroads. A decisive breakout above $4.8K could extend this leg higher toward $5K, while failure to absorb supply at this level would likely lead to a pullback toward $4.4K, where demand will be tested to validate the breakout.

Sentiment Analysis

By Shayan

Ethereum’s latest upswing was fueled by a sharp short squeeze, as clustered leveraged shorts were liquidated once the price broke above local highs. This liquidation cascade created rapid upward momentum, flushing out sellers and clearing liquidity from the upside.

However, the squeeze also left behind a dense liquidity pocket in the $4.5K–$4.4K range, just beneath recent lows. This zone now becomes critical to monitor. If Ethereum stalls at the current resistance cluster, price could gravitate back to this liquidity pool to rebalance and test underlying demand.

In short, Ethereum’s breakout unfolded precisely as anticipated: short pressure unwound into a powerful push higher, but the sustainability of this move now hinges on buyers’ ability to defend reclaimed levels. The next sessions will decide whether Ethereum consolidates strength for a fresh ATH attempt or retraces to absorb fresh liquidity.

The post Ethereum Price Analysis: Is $5K Inevitable as ETH Finally Breaks Out? appeared first on CryptoPotato.

Market Opportunity
Ethereum Logo
Ethereum Price(ETH)
$3,024.27
$3,024.27$3,024.27
-5.96%
USD
Ethereum (ETH) Live Price Chart
Disclaimer: The articles reposted on this site are sourced from public platforms and are provided for informational purposes only. They do not necessarily reflect the views of MEXC. All rights remain with the original authors. If you believe any content infringes on third-party rights, please contact service@support.mexc.com for removal. MEXC makes no guarantees regarding the accuracy, completeness, or timeliness of the content and is not responsible for any actions taken based on the information provided. The content does not constitute financial, legal, or other professional advice, nor should it be considered a recommendation or endorsement by MEXC.

You May Also Like

Robinhood’s New Move: MNT Coin Joins the Roster

Robinhood’s New Move: MNT Coin Joins the Roster

Bitcoin continues to hover beneath the $91,000 threshold, but the crypto domain isn’t stagnating. Cryptocurrency platforms are vigorously expanding their altcoin
Share
Coinstats2026/01/20 21:48
Microsoft Corp. $MSFT blue box area offers a buying opportunity

Microsoft Corp. $MSFT blue box area offers a buying opportunity

The post Microsoft Corp. $MSFT blue box area offers a buying opportunity appeared on BitcoinEthereumNews.com. In today’s article, we’ll examine the recent performance of Microsoft Corp. ($MSFT) through the lens of Elliott Wave Theory. We’ll review how the rally from the April 07, 2025 low unfolded as a 5-wave impulse followed by a 3-swing correction (ABC) and discuss our forecast for the next move. Let’s dive into the structure and expectations for this stock. Five wave impulse structure + ABC + WXY correction $MSFT 8H Elliott Wave chart 9.04.2025 In the 8-hour Elliott Wave count from Sep 04, 2025, we saw that $MSFT completed a 5-wave impulsive cycle at red III. As expected, this initial wave prompted a pullback. We anticipated this pullback to unfold in 3 swings and find buyers in the equal legs area between $497.02 and $471.06 This setup aligns with a typical Elliott Wave correction pattern (ABC), in which the market pauses briefly before resuming its primary trend. $MSFT 8H Elliott Wave chart 7.14.2025 The update, 10 days later, shows the stock finding support from the equal legs area as predicted allowing traders to get risk free. The stock is expected to bounce towards 525 – 532 before deciding if the bounce is a connector or the next leg higher. A break into new ATHs will confirm the latter and can see it trade higher towards 570 – 593 area. Until then, traders should get risk free and protect their capital in case of a WXY double correction. Conclusion In conclusion, our Elliott Wave analysis of Microsoft Corp. ($MSFT) suggested that it remains supported against April 07, 2025 lows and bounce from the blue box area. In the meantime, keep an eye out for any corrective pullbacks that may offer entry opportunities. By applying Elliott Wave Theory, traders can better anticipate the structure of upcoming moves and enhance risk management in volatile markets. Source: https://www.fxstreet.com/news/microsoft-corp-msft-blue-box-area-offers-a-buying-opportunity-202509171323
Share
BitcoinEthereumNews2025/09/18 03:50
Robinhood Crypto has listed the MNT token.

Robinhood Crypto has listed the MNT token.

PANews reported on January 20 that Robinhood announced on its X platform that the MNT token is now available for trading on Robinhood Crypto, including in the New
Share
PANews2026/01/20 22:02