Data shows Bitcoin has lost interest to Ethereum and altcoins recently as their combined futures volume has broken past the 85% mark. Ethereum & Altcoins Have Seen Their Futures Volume Rise Recently In a new post on X, CryptoQuant community analyst Maartunn has talked about the latest trend in the futures trading volume share of […]Data shows Bitcoin has lost interest to Ethereum and altcoins recently as their combined futures volume has broken past the 85% mark. Ethereum & Altcoins Have Seen Their Futures Volume Rise Recently In a new post on X, CryptoQuant community analyst Maartunn has talked about the latest trend in the futures trading volume share of […]

Ethereum & Altcoins Capture 85% Of Futures Trading, Bitcoin Share Shrinks

Data shows Bitcoin has lost interest to Ethereum and altcoins recently as their combined futures volume has broken past the 85% mark.

Ethereum & Altcoins Have Seen Their Futures Volume Rise Recently

In a new post on X, CryptoQuant community analyst Maartunn has talked about the latest trend in the futures trading volume share of Ethereum and the altcoins. The futures trading volume here naturally refers to the amount that’s becoming involved in futures-related trades on the various derivatives exchanges.

Below is the chart shared by Maartunn that shows the trend in the dominance in this metric for ETH and the alts over the last couple of years:

Ethereum & Altcoins Volume

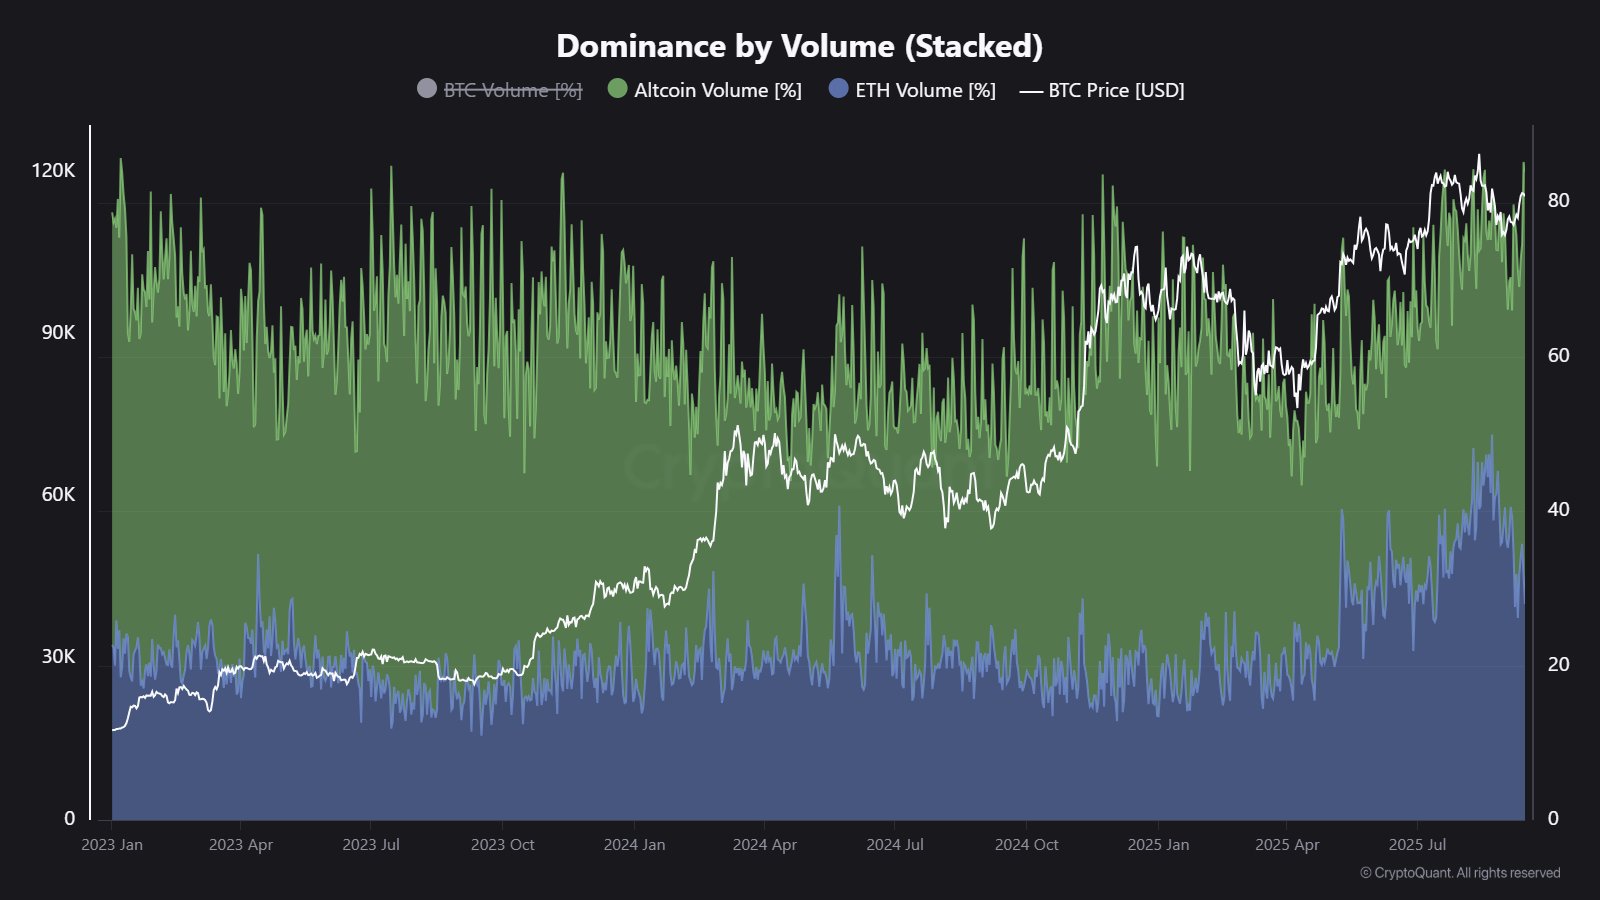
As is visible in the graph, the futures trading volume dominance has seen a sharp increase for the altcoins recently, implying that speculative interest in these coins has gone up.

The metric is still significantly down for Ethereum compared to its earlier high, but it has nonetheless also enjoyed an uptick at the same time as the altcoin growth.

Combined, ETH and the alts occupy around 85.2% of the total cryptocurrency futures trading volume following the increase. This means that the remaining portion, Bitcoin, has gone below 15% in dominance.

Historically, periods like these have been a bad omen for not just BTC, but the market as a whole. Examples of these are visible in the chart during both the late 2024 and Summer 2025 price tops.

Thus, considering that Ethereum and the altcoins are once again dominating futures trading activity, it’s possible that Bitcoin and other assets may be in for some volatility.

In some other news, on-chain analytics firm Santiment has shared in an X post an update on how the various projects in the digital asset sector rank up in terms of the Development Activity. This indicator measures the total amount of work that the developers of a given project are doing on its public GitHub repositories.

The metric makes its measurement in units of “events,” where one event is any action taken by the developer on the repository, like the push of a commit or creation of a fork.

Here is the table posted by Santiment that shows the ranking for cryptocurrency projects on the basis of their 30-day Development Activity:

Ethereum Development Activity

As displayed above, Ethereum is only the 10th largest project in terms of 30-day Development Activity, despite its market cap being second only to Bitcoin. The project that’s seeing its developers work the hardest right now is Internet Computer (ICP), which has the metric sitting at a value nearly three times that of ETH’s.

ETH Price

Ethereum recovered above $4,750 earlier, but it seems the asset’s price has once again faced a pullback as it’s now back at $4,450.

Ethereum Price Chart

Market Opportunity
RISE Logo
RISE Price(RISE)
$0.005288
$0.005288$0.005288
-2.21%
USD
RISE (RISE) Live Price Chart
Disclaimer: The articles reposted on this site are sourced from public platforms and are provided for informational purposes only. They do not necessarily reflect the views of MEXC. All rights remain with the original authors. If you believe any content infringes on third-party rights, please contact service@support.mexc.com for removal. MEXC makes no guarantees regarding the accuracy, completeness, or timeliness of the content and is not responsible for any actions taken based on the information provided. The content does not constitute financial, legal, or other professional advice, nor should it be considered a recommendation or endorsement by MEXC.

You May Also Like

The Surprising 2025 Decline In Online Interest Despite Market Turmoil

The Surprising 2025 Decline In Online Interest Despite Market Turmoil

The post The Surprising 2025 Decline In Online Interest Despite Market Turmoil appeared on BitcoinEthereumNews.com. Bitcoin Searches Plunge: The Surprising 2025
Share
BitcoinEthereumNews2026/01/21 14:56
Ethereum Name Service price prediction 2026-2032: Is ENS a good investment?

Ethereum Name Service price prediction 2026-2032: Is ENS a good investment?

Key takeaways: The Ethereum Name Service is a network that enables crypto enthusiasts to rename their cryptocurrency addresses into something simpler, making them
Share
Cryptopolitan2026/01/18 00:18
Cryptos Signal Divergence Ahead of Fed Rate Decision

Cryptos Signal Divergence Ahead of Fed Rate Decision

The post Cryptos Signal Divergence Ahead of Fed Rate Decision appeared on BitcoinEthereumNews.com. Crypto assets send conflicting signals ahead of the Federal Reserve’s September rate decision. On-chain data reveals a clear decrease in Bitcoin and Ethereum flowing into centralized exchanges, but a sharp increase in altcoin inflows. The findings come from a Tuesday report by CryptoQuant, an on-chain data platform. The firm’s data shows a stark divergence in coin volume, which has been observed in movements onto centralized exchanges over the past few weeks. Bitcoin and Ethereum Inflows Drop to Multi-Month Lows Sponsored Sponsored Bitcoin has seen a dramatic drop in exchange inflows, with the 7-day moving average plummeting to 25,000 BTC, its lowest level in over a year. The average deposit per transaction has fallen to 0.57 BTC as of September. This suggests that smaller retail investors, rather than large-scale whales, are responsible for the recent cash-outs. Ethereum is showing a similar trend, with its daily exchange inflows decreasing to a two-month low. CryptoQuant reported that the 7-day moving average for ETH deposits on exchanges is around 783,000 ETH, the lowest in two months. Other Altcoins See Renewed Selling Pressure In contrast, other altcoin deposit activity on exchanges has surged. The number of altcoin deposit transactions on centralized exchanges was quite steady in May and June of this year, maintaining a 7-day moving average of about 20,000 to 30,000. Recently, however, that figure has jumped to 55,000 transactions. Altcoins: Exchange Inflow Transaction Count. Source: CryptoQuant CryptoQuant projects that altcoins, given their increased inflow activity, could face relatively higher selling pressure compared to BTC and ETH. Meanwhile, the balance of stablecoins on exchanges—a key indicator of potential buying pressure—has increased significantly. The report notes that the exchange USDT balance, around $273 million in April, grew to $379 million by August 31, marking a new yearly high. CryptoQuant interprets this surge as a reflection of…
Share
BitcoinEthereumNews2025/09/18 01:01