A Deep Dive into Token Unlocks: What Are the Most Important Factors in Price Changes?
Author: Keyrock
Compiled by: Felix, PANews
Key points:
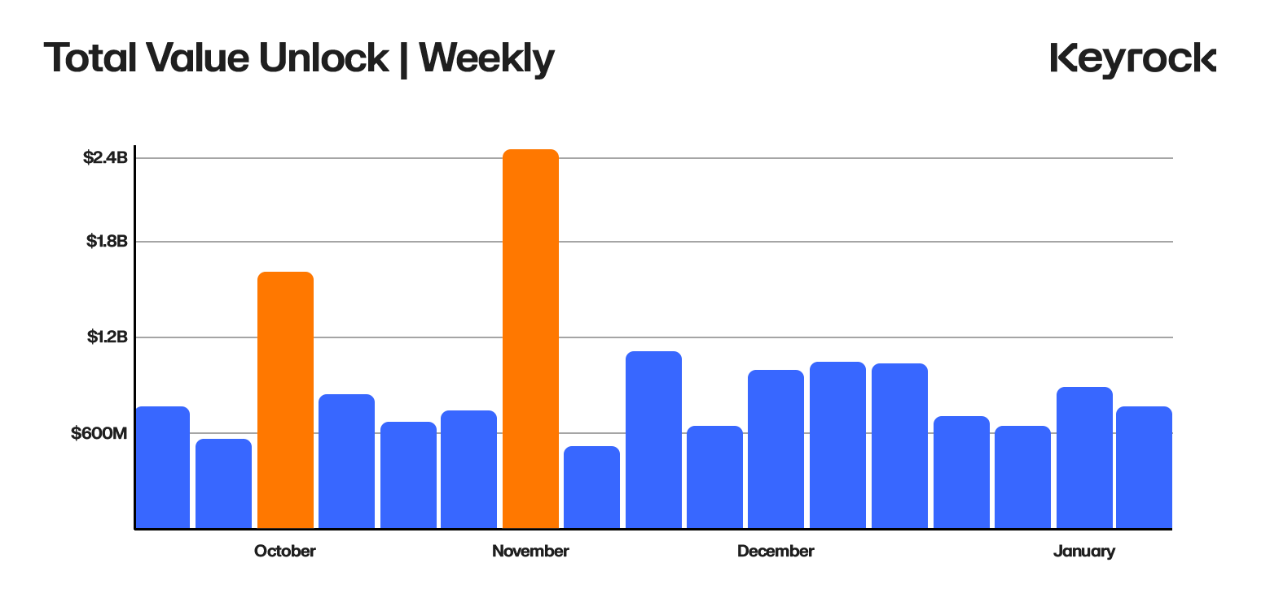
- Over $600 million in tokens unlocked every week
- 90% unlocking creates negative price pressure regardless of size or type
- The impact on token price usually starts 30 days before the unlocking event
- Larger unlocking leads to larger price drops (2.4x) and increased volatility
- Team unlocking will trigger the worst crash (-25%) and irrational selling
- Investors unlocking shows controlled price performance because they adopt smarter strategies and reduce the impact of unlocking on the market
- Ecosystem development unlocking was one of the few factors with a positive impact (average +1.18%)
Introduction
Over $600 million worth of locked tokens are unlocked every week (equivalent to Curve's market cap). These tokens are usually released at predetermined intervals, flowing into the hands of different participants. The size and interval of these unlocks, the expectations and dates, and who gets these tokens, all have an impact on the token value and the market.
In a crypto space dominated by short-term decision-making and rampant profit-taking, the cadence and structure of token unlocking is critical to ensuring long-term value capture and increasing holder satisfaction. Unlocking is not a novel concept. In traditional finance, mechanisms such as equity vesting have long been used to incentivize employees to stay aligned over the long term. However, in blockchain projects, the methods, frequency, and impact of token unlocking vary widely.
Across the 16,000 unlock events analyzed for this article, a striking pattern emerged: unlocks of all types, sizes, and recipients almost always had a negative impact on price.
This article takes a trader-centric approach to examine some of the most prominent token unlocks of the past few years. It analyzes how unlocks of different sizes and recipient types affect prices, identifying recurring patterns and key behavioral differences across the ecosystem.
Understanding Unlock
As a trader, you don’t have insight into the overall retail buying or selling decisions, but you can learn about another group of holders, those on the vesting schedule. Unlocking schedules are key to the puzzle, and they not only hint at future supply shocks, but are also leading indicators of sentiment and volatility.
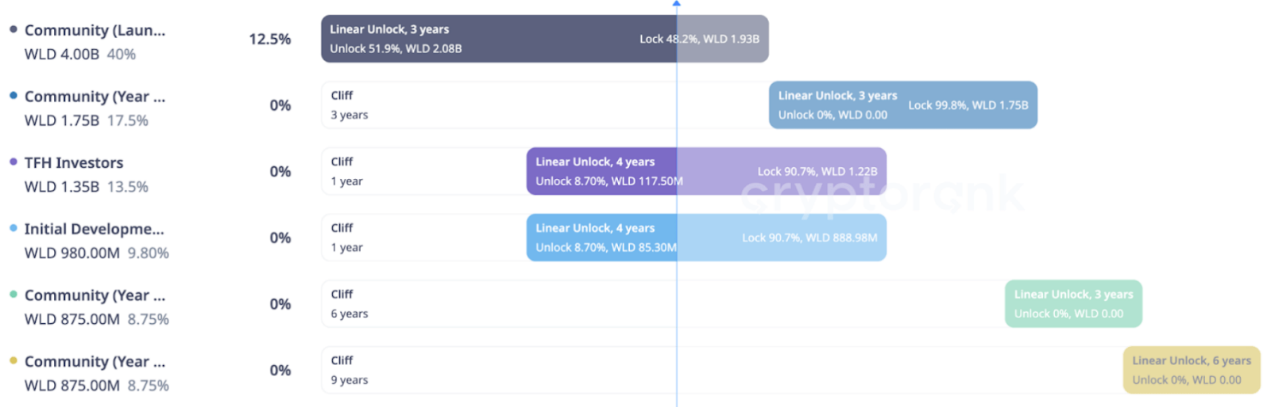
Most vesting tables look like the one above: a long-term calendar with “Cliffs” and “Linear or Bulk Unlock Blocks” labeled in the middle. These blocks are designated to different recipients — categories like “Seed Investors,” “Core Contributors,” or “Community.”
Designing an unlock is a tricky task for any project. You can’t simply give away all the tokens upfront, because the recipients might leave and sell them. But you can’t make them wait too long, or they might decide the project isn’t worth it. Projects must strike a balance: incentivizing recipients to stay in the early stages of the project while keeping them involved for the long term. The solution is often to distribute tokens gradually over a specified vesting period.
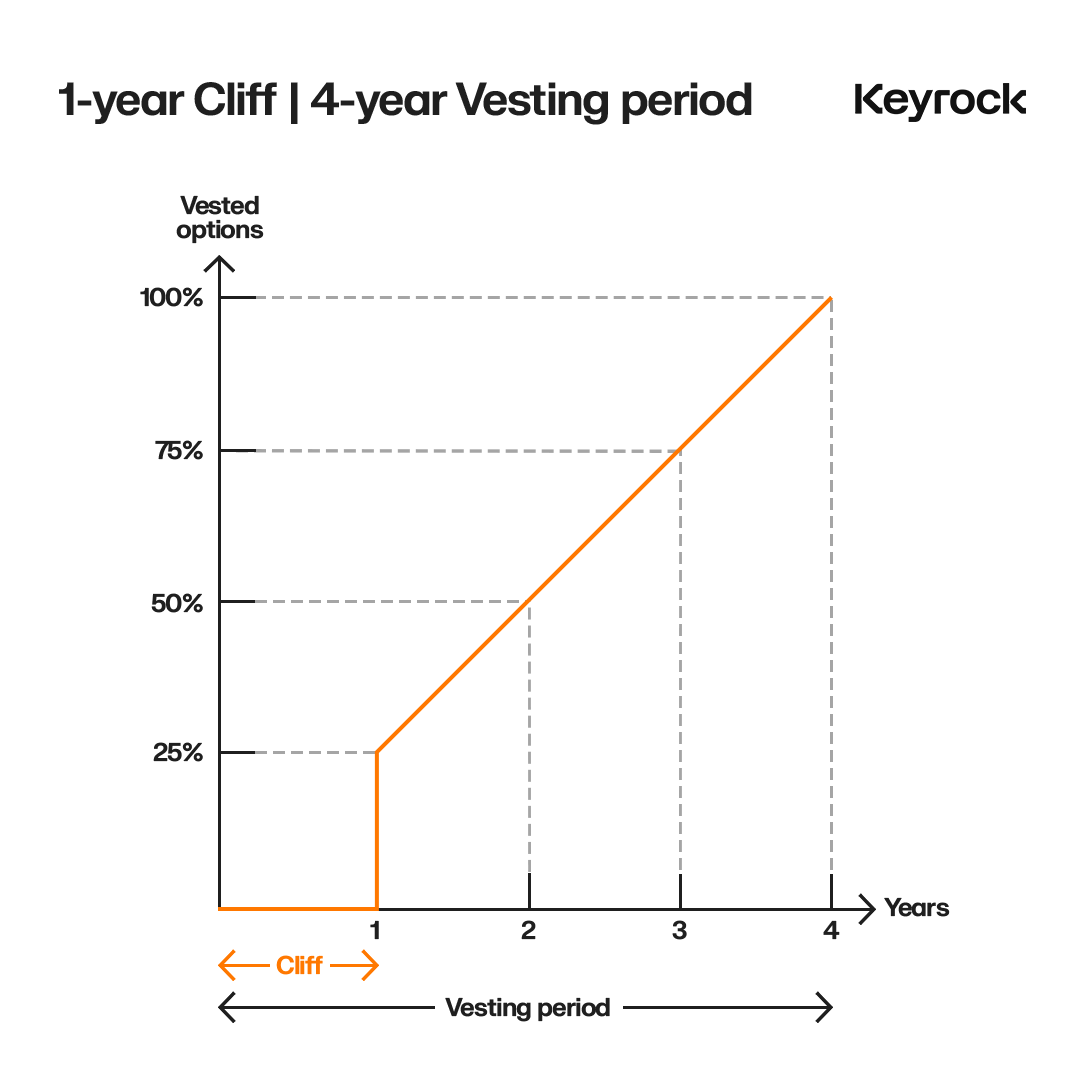
A typical unlock might look like this: The vesting period starts with the relationship between the recipient and the organization and continues until all allocations are made. For most crypto projects, these are outlined early in the whitepaper. There may be no allocations for the first ⅓ ± ¼ of the vesting period. Then, a large amount of tokens is released all at once, followed by a linear unlock over the remaining time.
This approach works well because it ensures recipients make a minimum commitment before receiving rewards. For example, developers are incentivized to continue participating, while investors face an initial lock-up period followed by partial cash-outs, and slow unlocking can reduce market pressure.
Not all unlocks follow this structure. Some are called “bulk unlocks” where all tokens are released at the end of the Cliffs period. Others are purely linear, starting with no Cliffs and distributing tokens periodically until they are fully allocated.
Unlocking scale, a key element of price dynamics
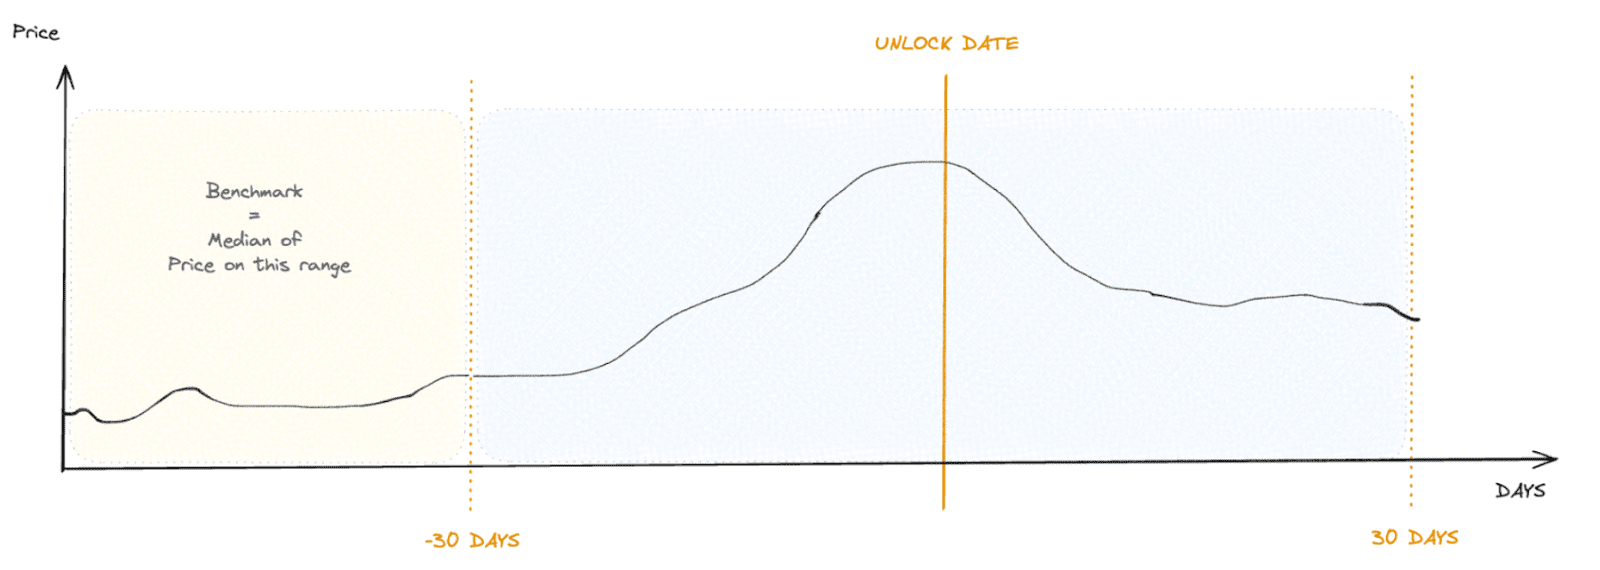
This article first breaks down the vesting period of 16,000 compound events and categorizes each event by size. For each event, the daily token price is tracked 30 days before and 30 days after the unlock. In addition, the "median" price and volatility metrics for each token in the month before the 30-day pre-unlock period are tracked. This is critical because many projects are on a monthly unlocking schedule. This method is not perfect, but it can better isolate smaller unlocks.
Finally, no asset can exist independently of the market. This is especially true for altcoins, which often exhibit extreme beta correlations with their protocol tokens. To account for this, this article normalizes the price changes in the data series for each unlock.

For simplicity, this article chooses ETH as the benchmark and then weights the prices in the sample (before, during, and after the unlock event) with ETH to produce a more market-independent metric.
Unlocking scale isn’t everything
After breaking down, categorizing, and quantifying the unlocking events, we plot the average price impact for different time intervals after the unlocking date. When visualized, the data looks messy. You might expect a proportional relationship between the size of the unlock and the price impact, but beyond 7 days, the correlation weakens.
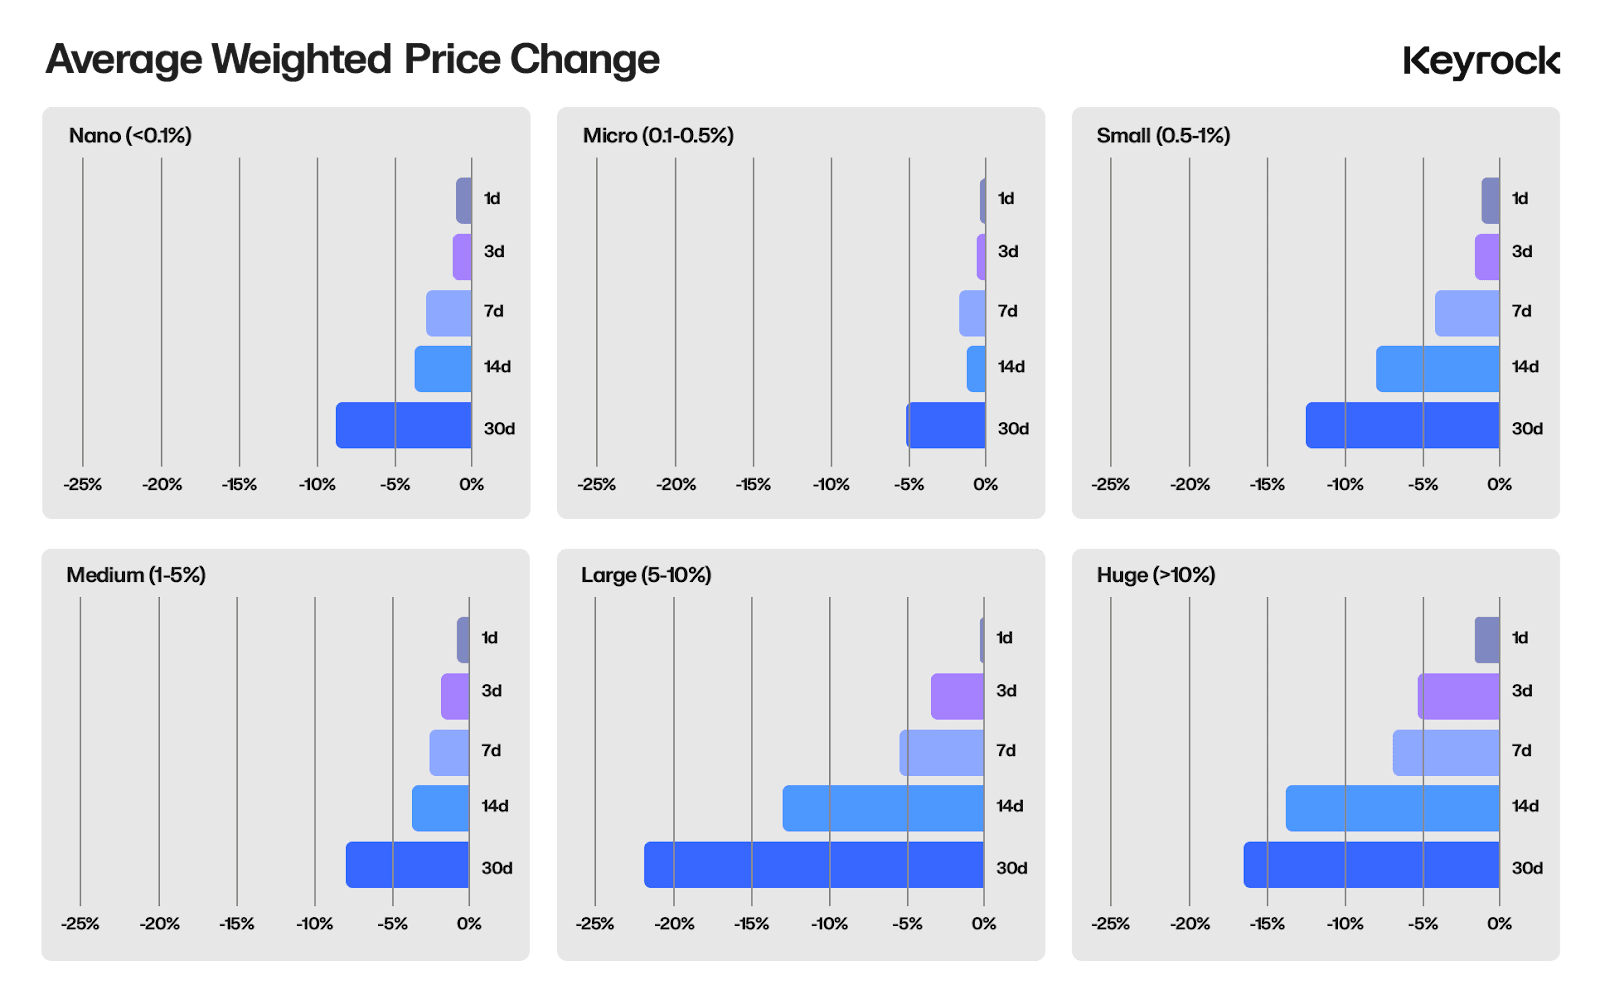
When scaled by relative size, most unlocks look similar in the degree of price suppression they cause. Instead, frequency is the more telling factor. As mentioned earlier, unlocks typically occur in a single large batch after the initial cliff, or continuously until the end of the vesting period. For any unlock other than the large or giant ones, the same consistent downward price pressure from smaller, steady unlocks is observed. It is therefore difficult to discern whether the size of the unlock is good or bad.
Cliffs and Linear Chasms
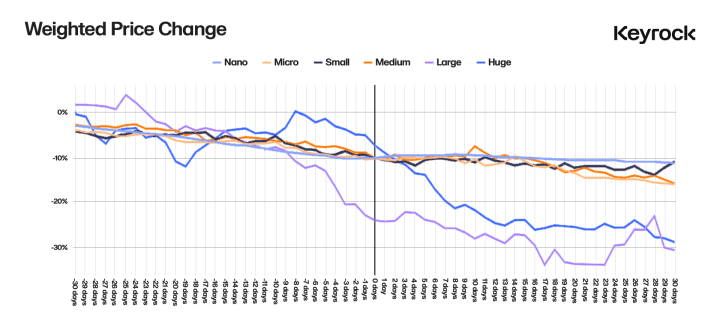
What is clearer in the data is the behavioral characteristics of larger unlocks before the event. In the 30 days before the event, we usually see a continuous decline in price, which accelerates in the last week. After the unlock, the price tends to stabilize and return to neutral levels within about 14 days.
This price behavior can be attributed to two main phenomena:
- Complex Hedging: Large unlocks are often allocated to hedge recipients using market makers. By locking in prices or taking advantage of volatility before unlocking, these parties reduce token pressure and mitigate the immediate impact of unlocking. Most companies start hedging 1-2 weeks or even a month in advance depending on the scale. If executed properly, this strategy can effectively minimize the impact of unlocking on the market.
- Retail investors anticipate: The sharp drop in the last week could be due to retail investors pushing down the price in advance. They knew the unlock was coming and sold tokens to avoid dilution, often without realizing that the recipients of the unlock may have already completed the sell-off by hedging.
This behavioral pattern is also evident in the weighted trading volumes of different categories, which usually peak 28 or 14 days before unlocking.
Interestingly, the data shows that huge unlocks (>10% of supply) perform as well or better than large unlocks (5%–10%). This is likely because the unlocks are too large to be fully hedged and cannot be sold off or unwound within 30 days. Therefore, their market effects tend to be more gradual and long-lasting.
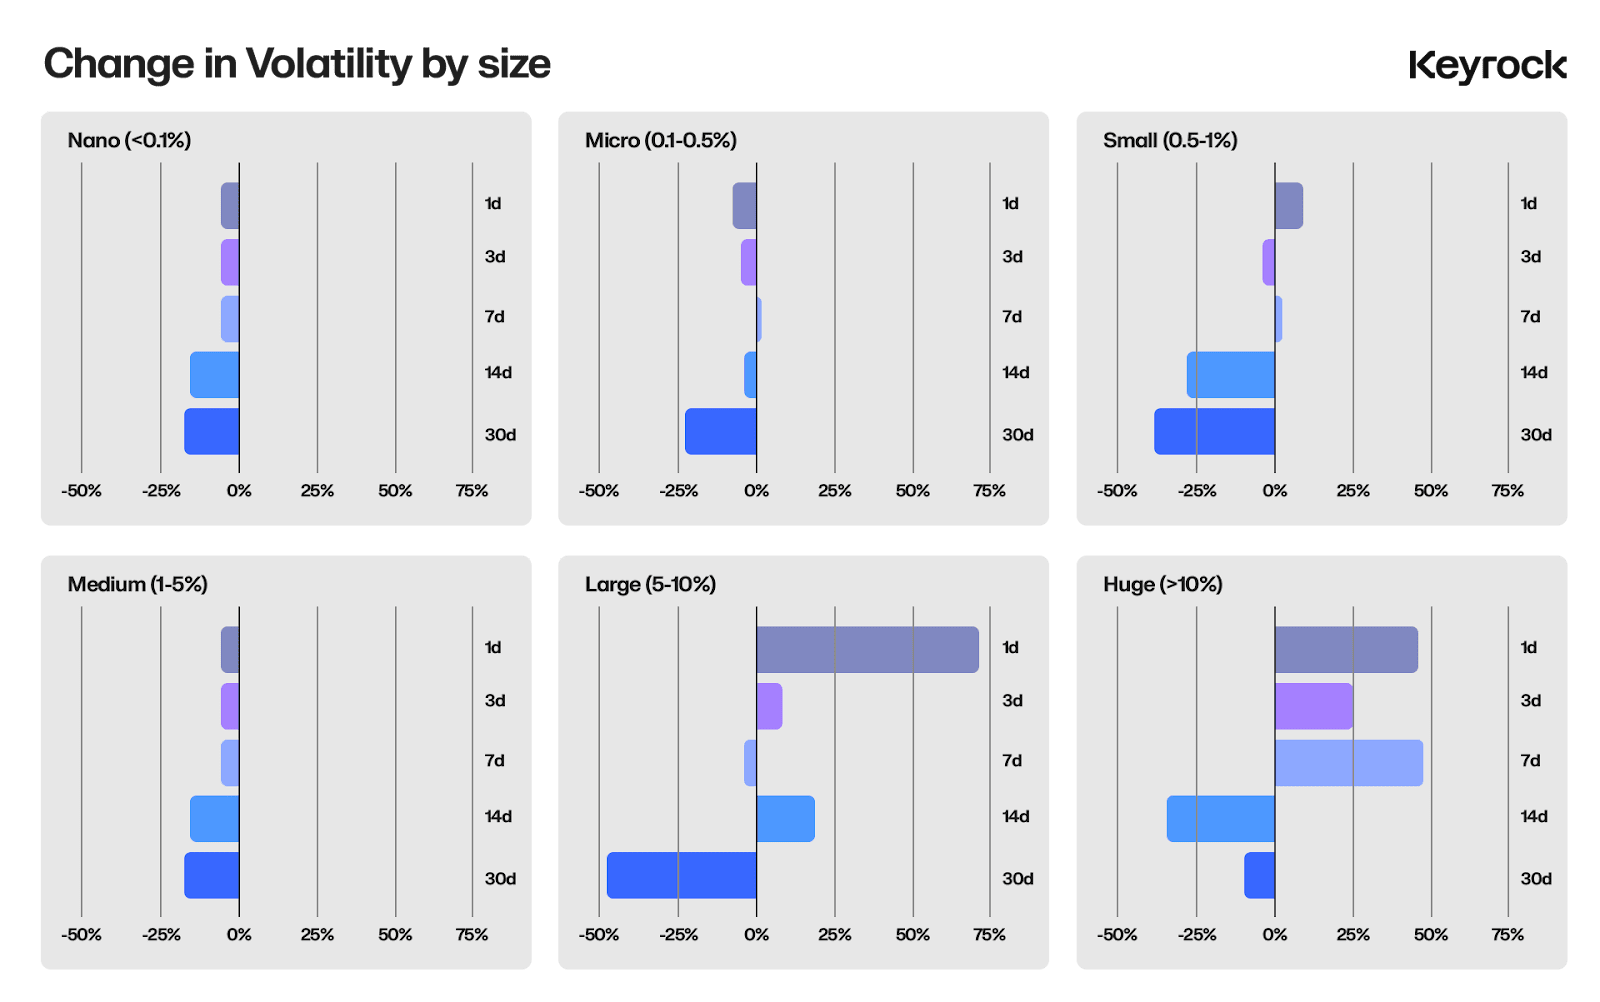
The last chart highlights the change in volatility. Large unlocks cause significant volatility on the first day. However, this volatility has largely subsided within 14 days.
How to trade?
Most of the time, the key is to focus on the very large and large unlocks on the calendar. These are usually the starting cliffs for the transition to linear unlocks. For any given unlock, the percentage awarded by the cliffs can vary widely, from 10% to 50%. What really matters is how much of the unlock is relative to the total supply.
Data shows that the best time to enter after a major unlock is 14 days later, when volatility has stabilized and hedges may have been unwound. For exits, the best time is 30 days before a major unlock, when hedging or market pre-reaction tends to kick in.
For smaller unlocks, it's usually best to wait until they are complete.
Receiver Type, a Key Predictor of Price Impact
The second and most important thing to look at when analyzing unlocks is the type of recipient. Who are the recipients of the tokens, and what does this mean for price action? Recipients can vary widely, but they generally fall into five main categories:
- Investor Unlocks: Tokens allocated to early investors as compensation for funding the project
- Team unlock: Tokens reserved for rewarding the core team, either through a one-time payment or as salary
- Ecosystem Development Unlock: Inject into the ecosystem to fund activities such as liquidity, network security or grants.
- Public/Community Unlock: Tokens are distributed to the public via airdrops, user rewards, or staking incentives.
- Burn Unlocks: Tokens that are unlocked only for burning, reducing supply. These are rare and therefore not included in this analysis.
Opinions vary as to which recipient type has the most impact on downstream prices. Some believe that community airdrops are mostly conducted by Sybil attackers, so the market is flooded with selling pressure. Others believe that injecting millions of tokens into the ecosystem dilutes value. Still others believe that VCs and investors are the ones who sell the fastest and take profits.
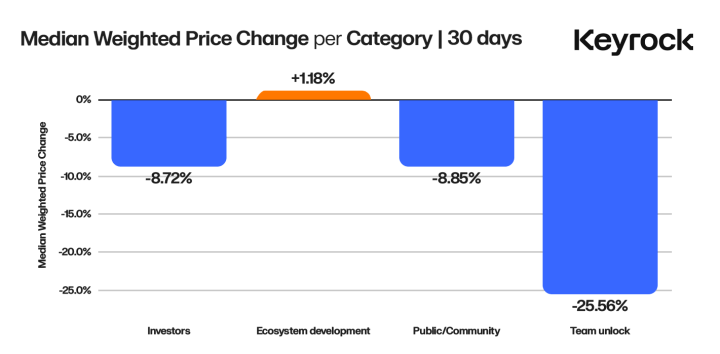
After analyzing thousands of unlocking events, the data shows that:
- Almost all categories showed negative price impacts, but with subtle differences
- Ecosystem development unlocks are the least disruptive, while team unlocks consistently result in the largest price drops
- Investor and public/community unlocking have a moderate impact on price
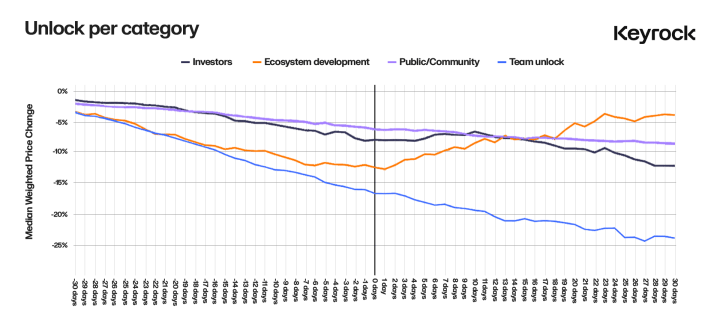
However, as with the size of the unlock, these numbers alone don’t tell the whole story. When you plot price action by recipient type in the 30 days before and after the unlock event, different behaviors emerge.
What drives the recipient's behavior?
At first glance, team unlocks appear to be the most disruptive, while ecosystem unlocks pose little threat. But these are only surface-level insights. Why are there differences? What drives recipient behavior? What lessons can protocols learn from this data?
Team Unlock
Team unlocks are one of the worst categories for price stability. You should be careful when a team is about to hit the Cliffs or is in the middle of a distribution.
When charted, impact token prices follow a roughly linear downward trend, starting 30 days before the unlock date and continuing down at a severe angle. Team unlocks tend to have two characteristics that have a greater impact on price than other categories of receipts.
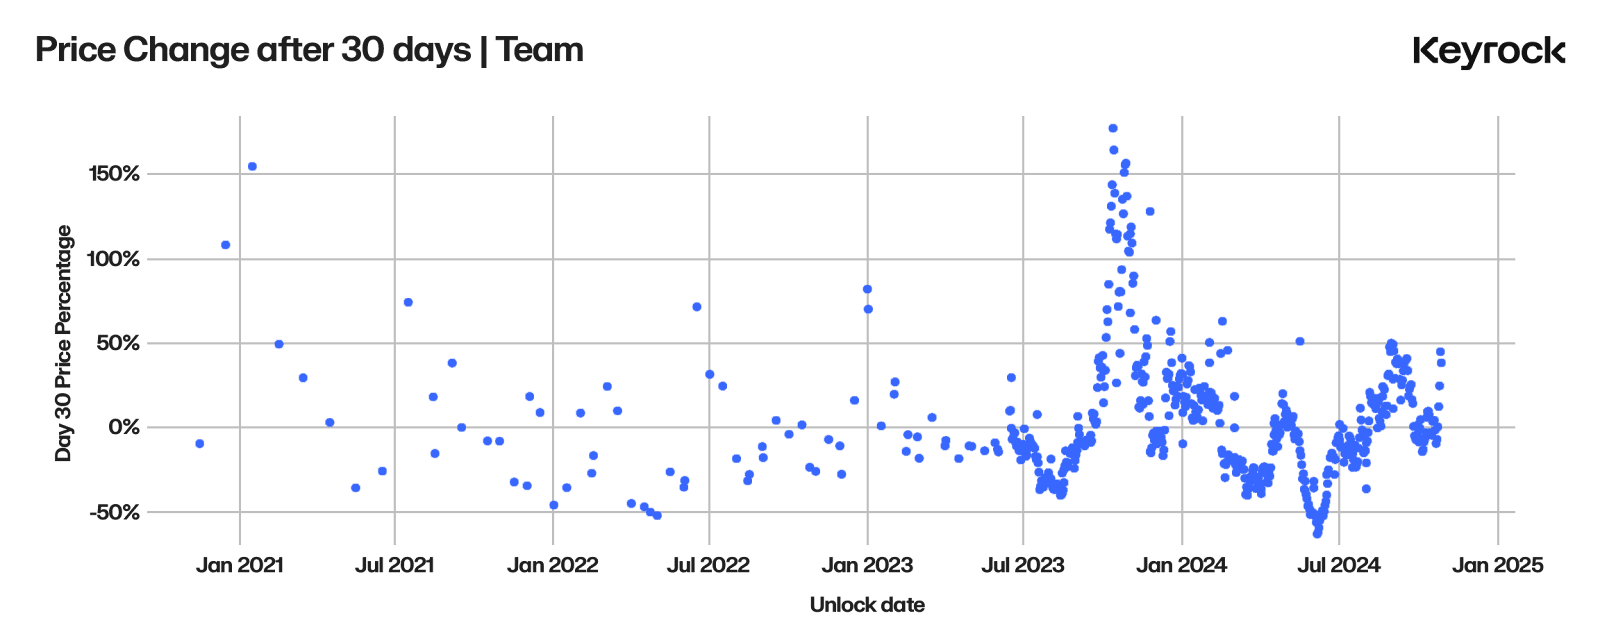
Uncoordinated selling by team members:
- Teams are often made up of multiple players with different financial goals and no coordinated method to liquidate their tokens
- Many team members view their tokens as compensation for long-term (sometimes years) labor before being properly compensated. When these tokens unlock, especially near the Cliffs, the motivation to profit is understandably high.
- Even if unlocked linearly, these tokens are usually part of their income and need to be sold
Lack of hedging or mitigation strategies:
- Unlike large investors or institutions, teams rarely use complex techniques to reduce market impact when selling
- Experienced entities often recruit market makers to strategically manage large token allocations
- Additionally, pre-hedging strategies can reduce the immediate pressure on the market when unlocking occurs over time.
So these explain why the price was so negative, but why was the price decline also observed in the first 30 days? This is likely largely a combination of severe price impacts and overlapping linear unlocks. Why try to control for median price before looking at it, as many of the unlocks are sequential, the data still shows that there is suppression. In this regard, if you do your best, not only skip the bulk Cliffs unlocks, but also hold off on buying during the linear period of the unlocks.
Ecosystem Development Unlocked
In terms of ecosystem development, we see a unique trend: a slight price drop in the first 30 days of unlocking, followed by an immediate positive price impact after unlocking. Unlike other unlock types, ecosystem development unlocks typically direct tokens toward initiatives that create long-term value and strengthen the protocol.
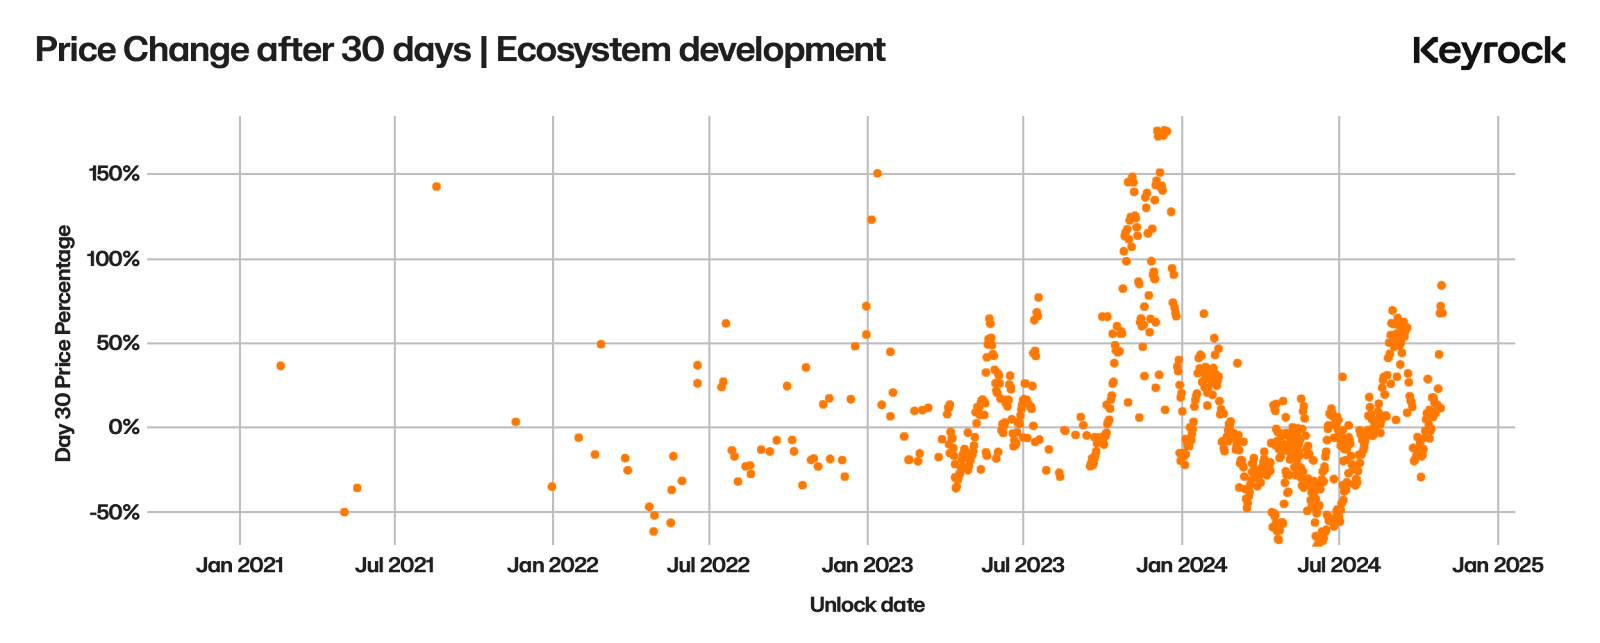
Why prices go back up (and often go up) after unlocking:
- Liquidity provision: Tokens are frequently allocated to lending platforms or liquidity pools, thereby increasing market depth, reducing slippage, and improving overall token availability. By enhancing “market availability”, these unlocks not only stabilize trading conditions but also increase the confidence of participants.
- Participation incentives: Ecosystem funds often drive user participation through incentive programs. These initiatives (such as liquidity mining or staking rewards) create a flywheel effect of participation, which in turn boosts network activity. As participants recognize the potential for continued growth, they are less likely to sell immediately and instead choose to continue investing in the ecosystem.
- Grants and Infrastructure Funding: Developer grants and infrastructure project funding support the creation of dApps and network scalability. While the benefits of these investments typically take 6-12 months to realize, they demonstrate a long-term commitment to ecosystem growth, thereby mitigating short-term selling pressure.
How to explain the price drop before unlocking? There are two reasons for this behavior.
- Anticipated Selling: As mentioned previously, many investors sell in advance of an unlock, believing that increasing token supply will dilute value, regardless of the purpose of the unlock. This is especially common among retail participants, whose misunderstanding of the unlock type drives short-term decisions.
- Liquidity preparation: Large recipients of grants or allocations often need to prepare liquidity in advance. For example, in order to build a liquidity pool on a DEX, recipients may sell existing assets to secure stablecoins or other paired assets. This preparatory selling can create downward price pressure even before the token is deployed.
Investor Unlock
Investor unlocks are one of the most predictable events in the token market. Unlike other categories, these unlocks typically exhibit controlled price performance, and data from 106 unlock events shows a consistent trend: slow, minimal price declines. This stability is not accidental. Early investors (whether angel or C round) usually have VC backgrounds and have expertise in managing positions.
These investors aren't just shifting risk; they're actively avoiding moves that could disrupt the market while optimizing returns. By understanding the complex strategies they employ, traders can anticipate how these events will unfold and adjust their positions accordingly.
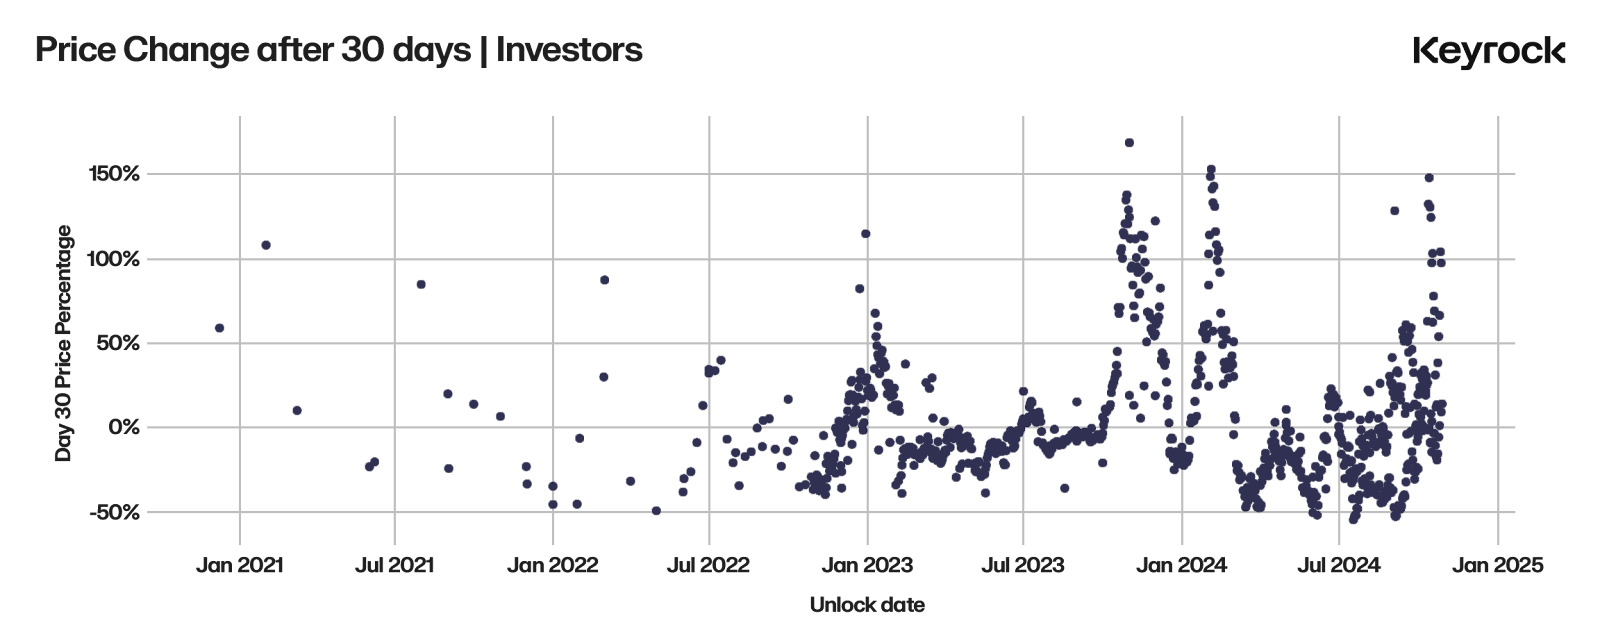
OTC desks: Investors often hire liquidity providers or OTC desks to sell large quantities of tokens directly to interested buyers. This approach bypasses the public order book entirely, preventing sellers from exerting immediate pressure and sending signals to the market.
T/VWAP and Hedging: Time-weighted average price (TWAP) execution or volume-weighted average price (VWAP) strategies help spread token sales over time, reducing price impact. Many investors also pre-hedge their positions using futures to “lock in” prices before an unlocking event. These positions are then gradually unwound after the unlock to further reduce volatility.
“Locking” or “hedging” is actually using derivatives to open a short position before the unlock date, which helps to guarantee the price early when the short position is unwound when the token is sold.
Since 2021, the use of advanced options strategies has expanded beyond investors, with more and more project teams adopting them to generate recurring income or manage funds more efficiently. For traders, this evolution reflects the growing sophistication of the crypto market, unlocking opportunities to predict and align with the strategies of major players. Options, whether sold privately or used as loan collateral, play a key role in shaping market dynamics, providing informed traders with a clearer perspective to interpret token activity.
Community and public unlocking
Community and public unlocks, such as airdrops and points-based reward programs, behaviorally mirror investor unlocks, with prices gradually decreasing before and after the event. This dynamic is shaped by two different behaviors among recipients:
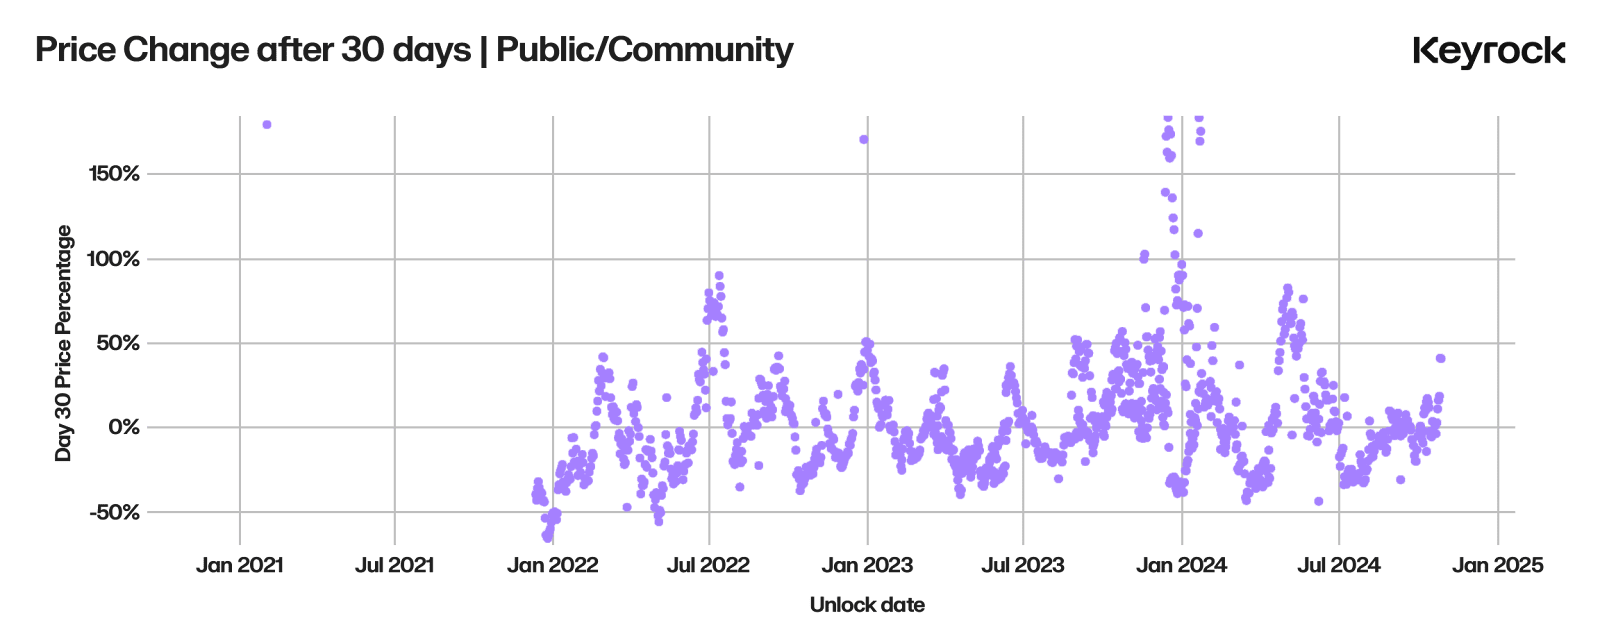
- Sell Immediately: Many retail participants liquidate rewards as soon as they are received, prioritizing liquidity.
- Long-term holders: Most public airdrops are held rather than sold, reflecting a group of engaged users or less active traders.
While the overall price impact was modest, these results highlight the importance of a well-designed rewards program. Thoughtful design can prevent unnecessary market disruption while achieving the desired goal of fostering community growth and engagement.
Summarize
Token unlocks are an essential mechanism in the crypto ecosystem, used to fund development, incentivize participation, and reward contributors. However, their spacing, size, and recipient categories are key factors in determining their price impact. Understanding what these effects are and why they occur can help make better deals and help protocols better structure their unlocks.
This article’s analysis of over 16,000 unlock events across 40 tokens highlights key trends:
- Linear unlocking is better than initial cliff unlocking in terms of reducing short-term destructiveness to price, although larger cliffs generally recover better after 30 days.
- The most significant price movements often come not from token recipients, but from retail investors reacting to narratives and broader sentiment.
Recipient Category Dynamics
- Ecosystem Unlocked: Sustained positive outcomes, driving growth through liquidity provision, user incentives, and infrastructure funding.
- Investor Unlock: Minimal disruption due to sophisticated strategies such as OTC sales, TWAP/VWAP execution and options hedging.
- Team Unlock: The most destructive category, poor coordination and immature selling methods lead to large price drops. Teams can mitigate the impact by working with market makers.
- Community unlocking: Limited long-term impact as many recipients hold tokens, but short-term “miners” often sell tokens for immediate gains.
in conclusion
Before making a long trade, always check the unlock calendar using tools like CryptoRank, Tokonomist, or Coingecko. Unlock events are often misunderstood, but they play a crucial role in a token’s performance.
Contrary to popular belief, VC and investor unlocks are not a major factor in price declines. These participants are often aligned with the long-term goals of the protocol, employing strategies that limit market disruptions and maximize returns. In contrast, team unlocks require closer attention, as poorly managed allocations often lead to downward pressure on token prices. Ecosystem unlocks present a unique opportunity and, when aligned with clear growth goals, often serve as a catalyst for adoption and liquidity, making it a favorable time to enter the market.
Related reading: How to solve the token unlocking selling pressure problem? Hack VC proposes two potential solutions
You May Also Like

Will the 10% Rally Build Into a Bigger Run?

Strategic Surge: BlackRock’s Major Digital Asset Expansion with 7 Key Hires