Shiba Inu price crashed by over 3% on Thursday, even as the burn rate skyrocketed by over 816%. Shiba Inu (SHIB) dropped to $0.00001212, down by 25% from its highest level in July. It is also sitting at a crucial…Shiba Inu price crashed by over 3% on Thursday, even as the burn rate skyrocketed by over 816%. Shiba Inu (SHIB) dropped to $0.00001212, down by 25% from its highest level in July. It is also sitting at a crucial…

Shiba inu price plunges despite 800% burn rate surge: here’s why

2025/09/05 02:52
2 min read
For feedback or concerns regarding this content, please contact us at crypto.news@mexc.com

Shiba Inu price crashed by over 3% on Thursday, even as the burn rate skyrocketed by over 816%.

Shiba Inu (SHIB) dropped to $0.00001212, down by 25% from its highest level in July. It is also sitting at a crucial support level, putting it at risk of a strong bearish breakout. 

SHIB price plunged even as the burn rate rose because of the performance of the crypto market. Bitcoin and most altcoins were deeply in the red as traders waited for the upcoming non-farm payroll data.

The second reason is that there is no direct correlation between a coin’s burn rate and its price action. For example, SHIB has plunged by double digits despite burning over 410 trillion tokens since its inception. 

Additionally, while an 816% increase is a big one, the number of incinerated tokens was 5.3 million. In SHIB terms, these tokens were worth just $63, a tiny amount for a cryptocurrency valued at over $7 billion.

One reason why the burn rate has been negligible is that Shibarium, its layer-2 network, is not generating any money. Its network fees in the last 24 hours were just 40 BONE, worth just $6.

Shiba Inu price technical analysis

Shiba Inu price

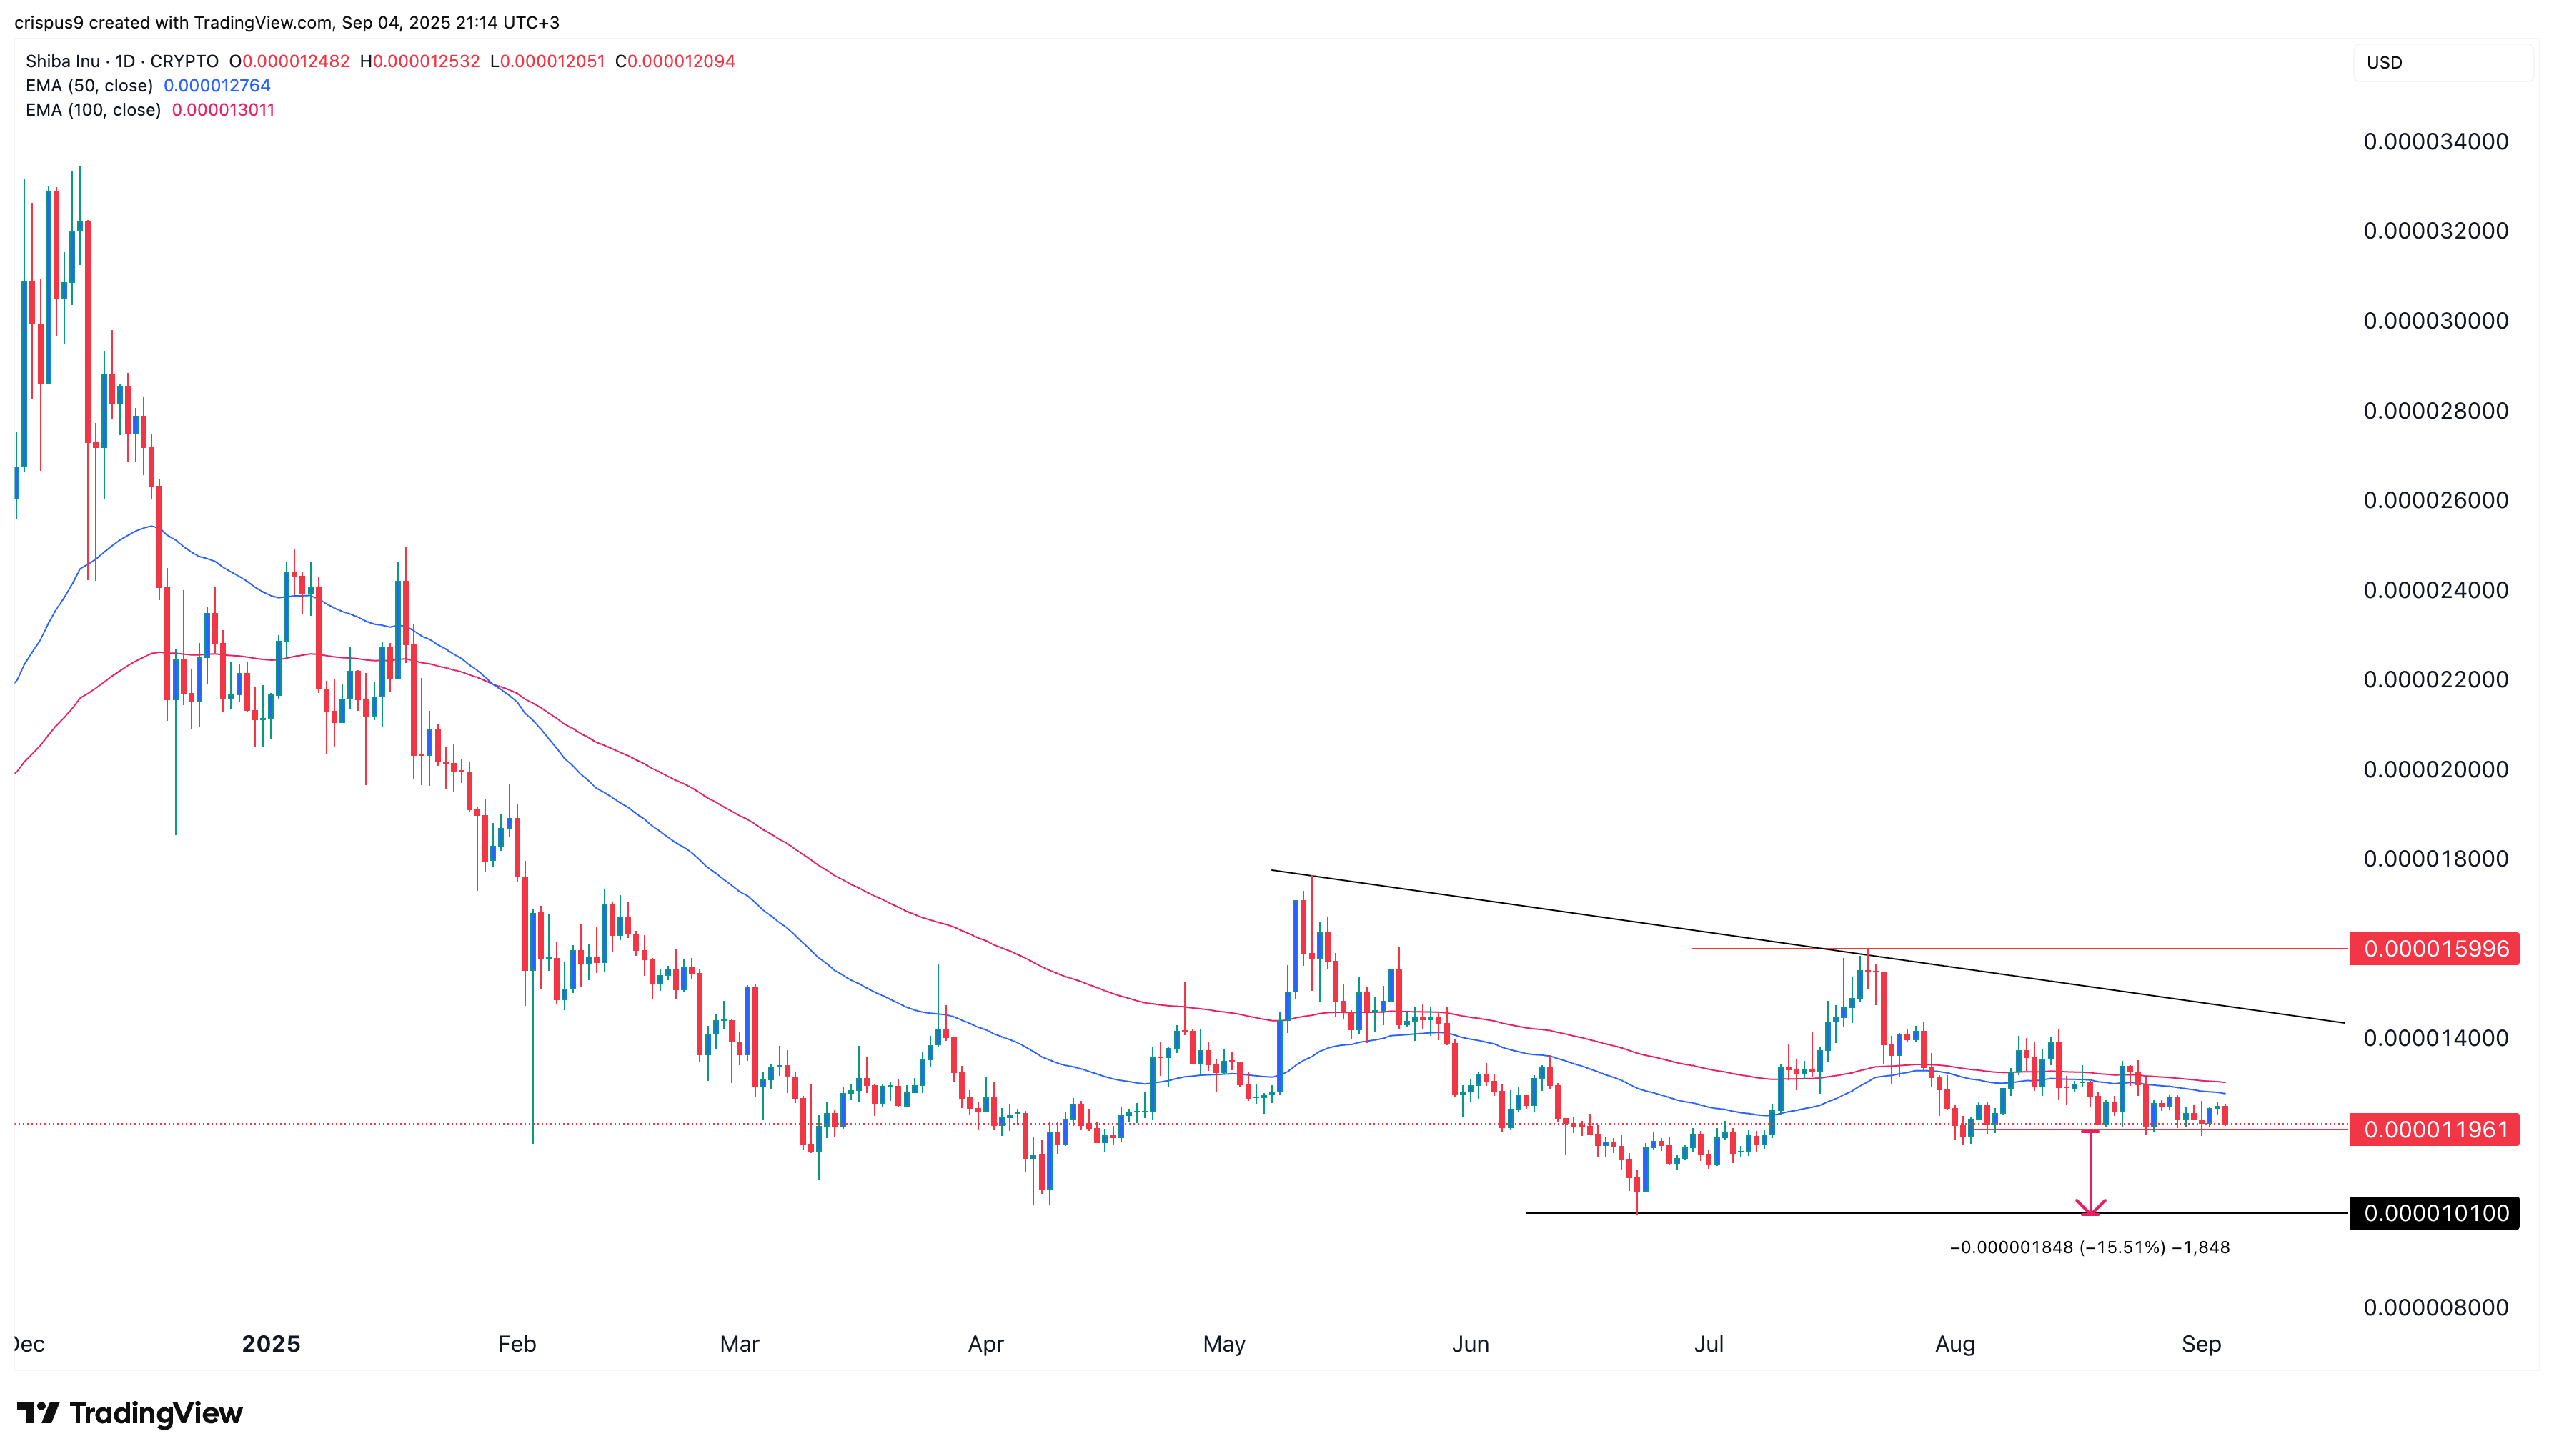
The daily chart shows that the SHIB price has pulled back in the past few weeks. It is trading at $0.00001210, an important level it has failed to break below several times since August.

SHIB has remained below the 50-day and 100-day Exponential Moving Averages. It also remains below the descending trendline that connects the swing highs in May.

Therefore, the coin will likely have a strong bearish breakout, potentially to the year-to-date low of $0.000010, down by 15% from the current level. 

Market Opportunity
SHIBAINU Logo
SHIBAINU Price(SHIB)
$0.000005675
$0.000005675$0.000005675
-1.32%
USD
SHIBAINU (SHIB) Live Price Chart
Disclaimer: The articles reposted on this site are sourced from public platforms and are provided for informational purposes only. They do not necessarily reflect the views of MEXC. All rights remain with the original authors. If you believe any content infringes on third-party rights, please contact crypto.news@mexc.com for removal. MEXC makes no guarantees regarding the accuracy, completeness, or timeliness of the content and is not responsible for any actions taken based on the information provided. The content does not constitute financial, legal, or other professional advice, nor should it be considered a recommendation or endorsement by MEXC.

You May Also Like

Provenance Blockchain (HASH) Jumps 23.8% as Trading Volume Reveals Supply Squeeze

Provenance Blockchain (HASH) Jumps 23.8% as Trading Volume Reveals Supply Squeeze

Provenance Blockchain's HASH token posted a surprising 23.8% gain in 24 hours, but the modest $114,406 trading volume tells a more complex story. Our analysis of
Share
Blockchainmagazine2026/03/19 21:03
Cryptos Signal Divergence Ahead of Fed Rate Decision

Cryptos Signal Divergence Ahead of Fed Rate Decision

The post Cryptos Signal Divergence Ahead of Fed Rate Decision appeared on BitcoinEthereumNews.com. Crypto assets send conflicting signals ahead of the Federal Reserve’s September rate decision. On-chain data reveals a clear decrease in Bitcoin and Ethereum flowing into centralized exchanges, but a sharp increase in altcoin inflows. The findings come from a Tuesday report by CryptoQuant, an on-chain data platform. The firm’s data shows a stark divergence in coin volume, which has been observed in movements onto centralized exchanges over the past few weeks. Bitcoin and Ethereum Inflows Drop to Multi-Month Lows Sponsored Sponsored Bitcoin has seen a dramatic drop in exchange inflows, with the 7-day moving average plummeting to 25,000 BTC, its lowest level in over a year. The average deposit per transaction has fallen to 0.57 BTC as of September. This suggests that smaller retail investors, rather than large-scale whales, are responsible for the recent cash-outs. Ethereum is showing a similar trend, with its daily exchange inflows decreasing to a two-month low. CryptoQuant reported that the 7-day moving average for ETH deposits on exchanges is around 783,000 ETH, the lowest in two months. Other Altcoins See Renewed Selling Pressure In contrast, other altcoin deposit activity on exchanges has surged. The number of altcoin deposit transactions on centralized exchanges was quite steady in May and June of this year, maintaining a 7-day moving average of about 20,000 to 30,000. Recently, however, that figure has jumped to 55,000 transactions. Altcoins: Exchange Inflow Transaction Count. Source: CryptoQuant CryptoQuant projects that altcoins, given their increased inflow activity, could face relatively higher selling pressure compared to BTC and ETH. Meanwhile, the balance of stablecoins on exchanges—a key indicator of potential buying pressure—has increased significantly. The report notes that the exchange USDT balance, around $273 million in April, grew to $379 million by August 31, marking a new yearly high. CryptoQuant interprets this surge as a reflection of…
Share
BitcoinEthereumNews2025/09/18 01:01
XRP and Chainlink Clash Again as Social Media Feud Returns

XRP and Chainlink Clash Again as Social Media Feud Returns

The post XRP and Chainlink Clash Again as Social Media Feud Returns appeared on BitcoinEthereumNews.com. Chainlink liaison Zach Rynes faced pushback after he labeled
Share
BitcoinEthereumNews2026/03/19 20:52