Will BNB price lose $600 support as a risky pattern forms?
BNB price is consolidating within a descending triangle pattern, with a horizontal support near $600 and a series of lower highs pressing against a downward-sloping resistance trendline, pointing to a potential breakdown.
- BNB price trades near $616, compressing within a descending triangle with key support at $600 and resistance around $625–$630.
- Price remains below major moving averages, with bearish MACD divergence and weakening momentum signaling downside risk toward $579–$580.
- Broader market pressure persists, with Fear & Greed Index in fear territory and Bitcoin’s $70K–$72K support seen as critical for BNB’s direction.
According to data from crypto.news, BNB (BNB) price was trading around $616 at press time on May 1, down roughly 1% over the past 24 hours. Over the past week, the token has largely moved between $600 and $635, reflecting a narrowing range as price compresses toward the apex of the triangle.
The asset remains significantly below its recent highs, still down more than 30% from levels above $900 seen earlier this year. Participation has also cooled, with price action lacking strong follow-through on either side. When price compresses near major support while volatility declines, it often signals that a larger move is approaching.
BNB price remains at risk of more downside as broader market conditions continue to weigh on risk assets like it.
The Crypto Fear & Greed Index remains in fear territory at 26, indicating weak risk appetite among investors. Traders appear hesitant to aggressively buy dips, especially as macro uncertainty builds.
BNB also remains highly correlated with Bitcoin (BTC). Analysts warn that if Bitcoin loses the $73,000–$74,000 support range, it could trigger a broader market sell-off, increasing downside pressure on altcoins like BNB.
At the same time, macroeconomic factors are adding to volatility expectations. Concerns over the Federal Reserve maintaining higher interest rates have reduced liquidity in risk markets. Upcoming U.S. data releases, including Non-Farm Payrolls on May 8 and CPI data on May 12, could further drive sharp price swings.
BNB price analysis
The daily chart shows BNB forming a tightening descending triangle, with a flat support near $580 and a descending resistance trendline connecting lower highs since February.
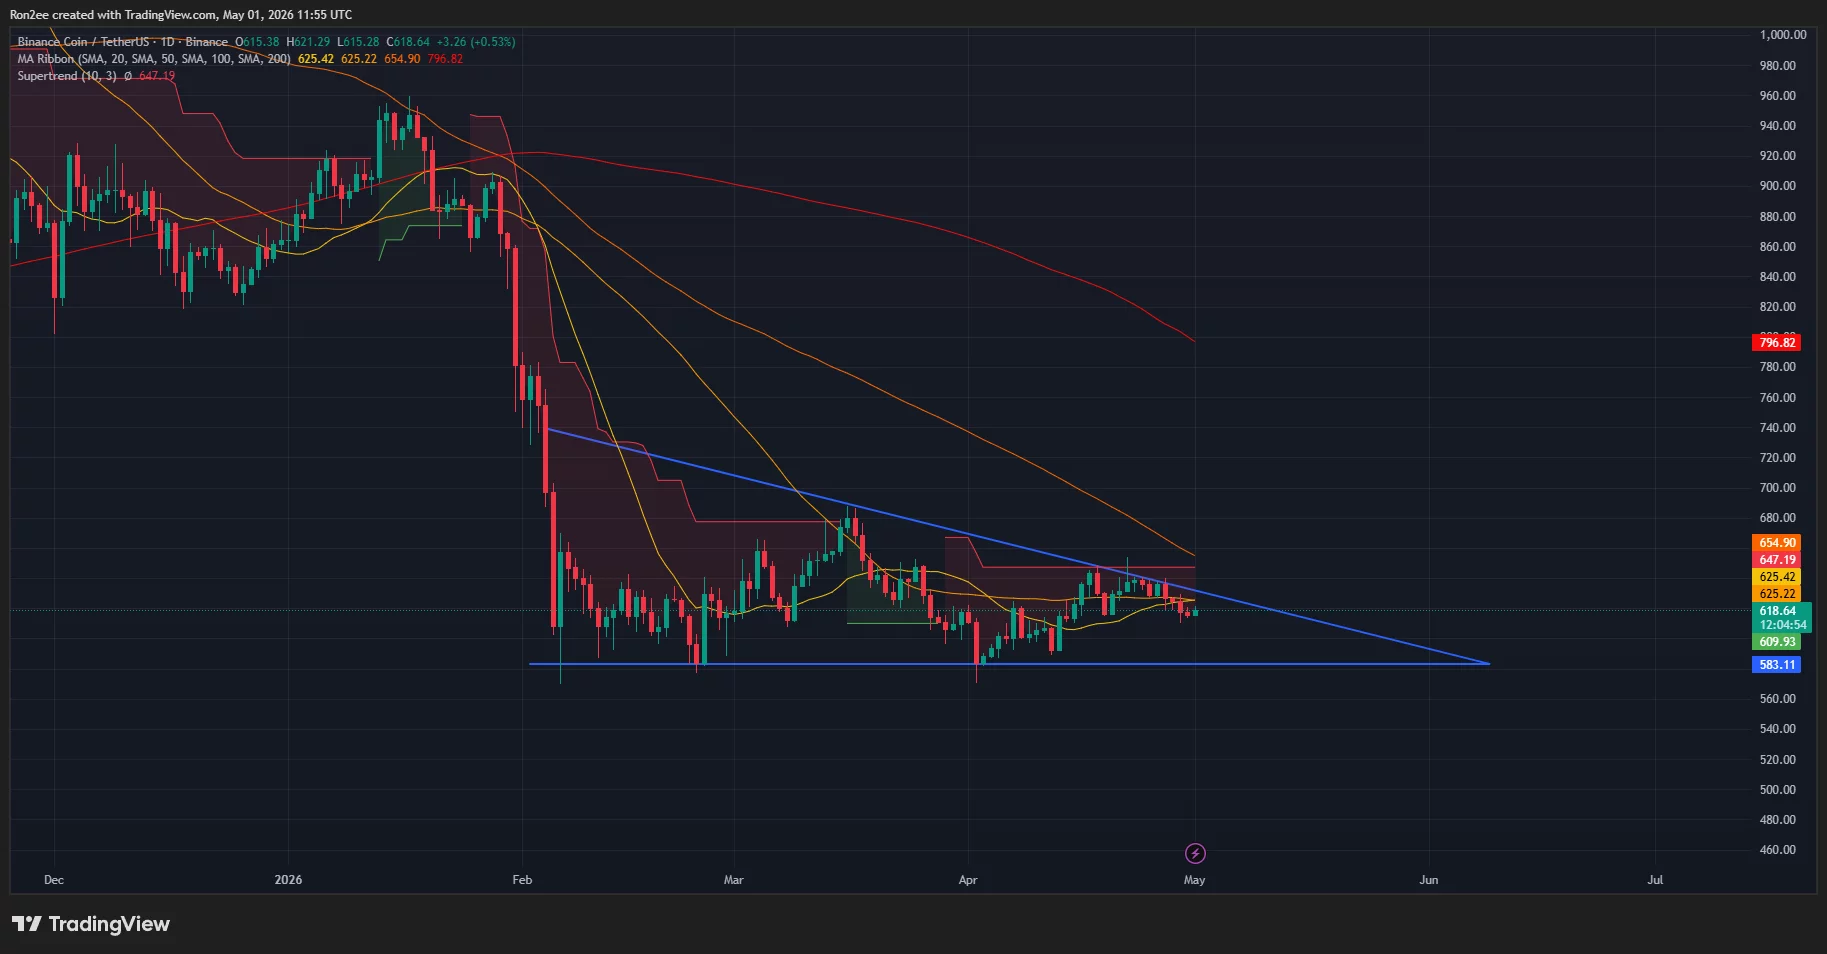
Repeated tests of the $600–$610 zone suggest buyers are still defending this level. However, each bounce has been weaker, indicating fading demand.
Momentum indicators also lean bearish. BNB is currently trading below its 50-day simple moving average near $625, a level that has now turned into resistance. The 100-day and 200-day SMAs, positioned higher around $654 and $796, respectively, further reinforce the broader downtrend.
In addition, a bearish divergence has been observed on the MACD histogram on the daily timeframe, suggesting that upward momentum is weakening despite recent attempts to stabilize.
Hence, a clean breakdown below the $600 support would confirm the bearish structure and could open the door toward the next major support near $580.
On the other hand, a strong move above the descending trendline and reclaim of the $625–$630 zone could invalidate the setup and shift momentum back in favor of buyers, though current signals suggest that scenario carries lower probability in the short term.
Disclosure: This article does not represent investment advice. The content and materials featured on this page are for educational purposes only.


Ayrıca Şunları da Beğenebilirsiniz

Drift Protocol Crashes 40.5% Despite $24M Market Cap: What the Data Reveals

Blue Owl Capital (OWL) Stock: Dips on Liquidity Concerns After Massive Exit Requests