

Tesla Stock tests 417–422 support as intraday momentum fades

Tesla Stock remains in an uptrend on the daily chart, but Friday’s slide into the 417–422 zone put the move on notice. The bias stays bullish while intraday momentum weakens. Near term, bulls must defend 417–422 and quickly reclaim 426–431 to reassert control.
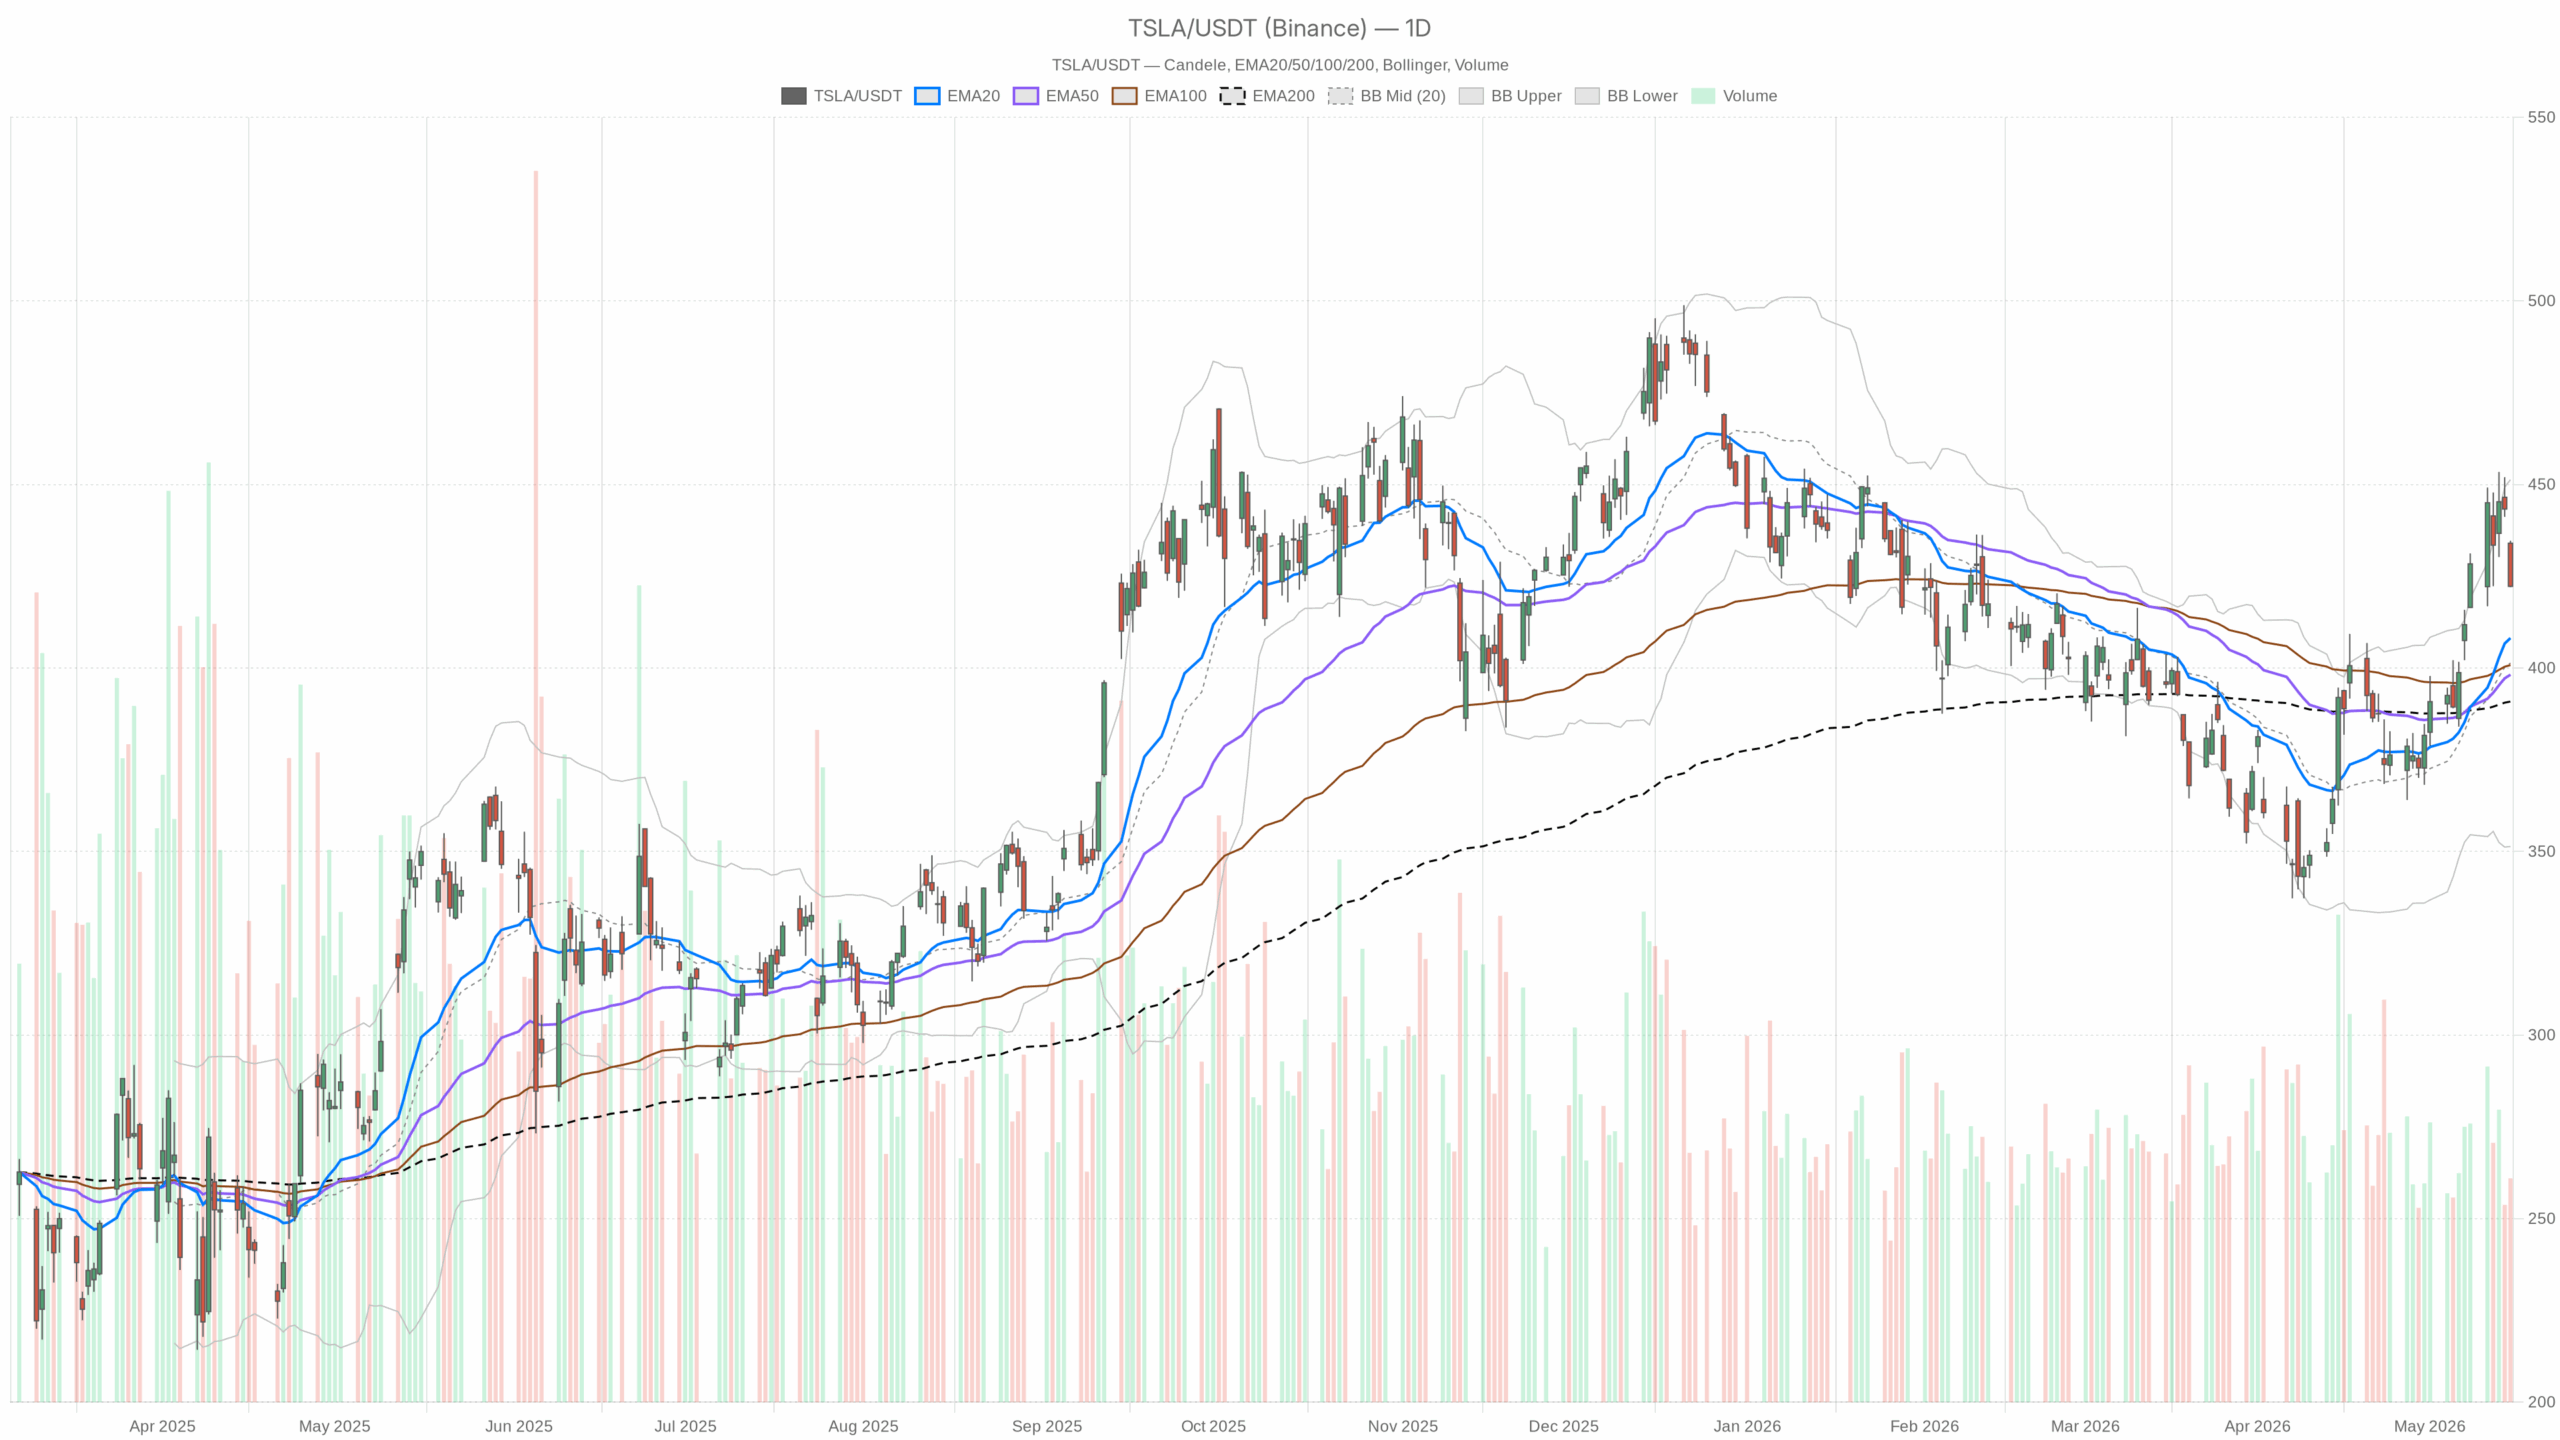 TSLA — daily chart with candlesticks, EMA20/EMA50 and volume.
Tesla Stock Daily Chart: Trend Up, Momentum Cooled
Price and Averages
On the daily timeframe, TSLA closed at 422.24 after rejecting the 434 area. Daily EMAs sit at 20/50/200 = 408.15/398.17/390.85. Price remains above all key averages, so the broader trend stays up. However, Friday’s rejection put 417–422 in focus.
Momentum, Volatility, and Pivots
Daily RSI14 is 57.96, signaling positive momentum without overbought conditions. MACD line/signal/hist is 15.32/10.73/4.59. Upside momentum persists, though it cooled with the reversal.
Bollinger mid/upper/lower stands at 401.32/451.28/351.36, with price in the upper half. Therefore, room remains before volatility extremes. Daily ATR14 is 17.29, indicating wide ranges. Daily pivot PP/R1/S1 is 426.30/430.60/417.94. Price closed below PP and near S1, so resistance is stacked overhead while support sits close.
Intraday View: 1H Weakness vs 200 EMA Support
Trend and Momentum
On the 1H chart, TSLA closed at 422.13. 1H EMAs are 20/50/200 = 433.04/427.66/401.07. Near-term momentum is soft below the 20 and 50 EMAs. Yet the larger backdrop stays constructive above the 200 EMA. 1H RSI14 is 37.02. Bears control the short term, but conditions are nearing oversold.
1H MACD line/signal/hist reads -2.44/0.69/-3.12, confirming active downside momentum.
Bands, Volatility, and Pivots
1H Bollinger mid/upper/lower is 438.82/459.45/418.18, with price near the lower band. Pressure looks stretched, and a bounce risk is building. 1H ATR14 is 5.26, so hourly swings are meaningful and can whipsaw failed breakouts. 1H pivot PP/R1/S1 is 422.99/423.98/421.14. The micro battleground sits at 423, with nearby support at 421.
15-Minute Chart: Execution Context for Tesla Stock
On the 15m view, EMAs are 20/50/200 = 426.77/432.11/426.65, with price below all. The micro trend is down.
15m RSI14 is 31.08, so conditions are near oversold and often precede a snapback. 15m MACD line/signal/hist is -2.98/-3.23/0.25. A minor bullish inflection is forming despite a negative backdrop.
15m Bollinger mid/upper/lower is 425.56/428.89/422.22, with price fractionally under the lower band. A brief mean-reversion pop is possible. 15m ATR14 is 1.99, and micro volatility can amplify stops around levels. 15m pivot PP/R1/S1 is 422.91/423.83/421.22. First tactical resistance is 423.83; first tactical support is 421.22.
News and Sentiment Drivers for TSLA
Headlines are mixed for sentiment. Tesla raised U.S. Model Y prices for the first time in two years, up to $1,000 on premium trims. This modestly supports pricing power and margins.
At the same time, fresh financing pushes in China aim to shore up demand after a weak April. Volume support is welcome; however, affordability moves can lean on margins.
Meanwhile, a disclosed CFO stock sale and growing robotaxi concerns complicate the longer-term narrative. Management selling and AI execution debate can cap multiples near resistance.
Scenarios: Bulls vs Bears at 417–422
Therefore, the bullish scenario centers on 417–422 holding and a quick reclaim of nearby resistance. A 1H close back above 422.99 (PP) and 423.98 (R1) would signal stabilization. That would show buyers absorbing supply. Further confirmation would be reclaiming the 1H EMA50 at 427.66 and the 1H EMA20 at 433.04. Short-term momentum would then flip back in line with the daily trend. If achieved, the next objectives sit near the daily PP/R1 at 426.30/430.60, then the 430–435 supply. A break there reopens 445–451 near the daily upper band.
On the other hand, the bearish scenario activates on a decisive break below 417.94 (daily S1). That would put the daily uptrend under pressure rather than leading. A failure there exposes the daily EMA20 at 408.15 and the Bollinger mid near 401.32. Invalidation of the bullish case would be sustained trade below 417. With 1H RSI anchored sub-40 and MACD negative, the market would be distributing, not consolidating.
Tesla Stock Outlook: Tactically Patient Into Early Week
Overall, positioning into early week favors tactical patience. For Tesla Stock, the daily uptrend is intact, yet hourly momentum is soft. Volatility is elevated (ATR near 17). Expect choppy tests of 417–422 before direction resolves. Until 1H momentum turns up or 417 breaks, respect the range. Stay alert to headlines on demand, pricing, and autonomy milestones.


You May Also Like

Solana price confirms bearish crossover following Drift exploit, will it crash?

Evercore ISI S&P 500 Forecast 2026: Base Case 7,750, Bull Case 9,000


