

Netflix Stock stays bearish near $87 as intraday signals stabilize

Overall, Netflix Stock remains bearish on the daily timeframe, with price pinned near $87 and rallies struggling to gain traction. Intraday signals show a stabilizing tape, yet they have not reversed the broader downtrend.
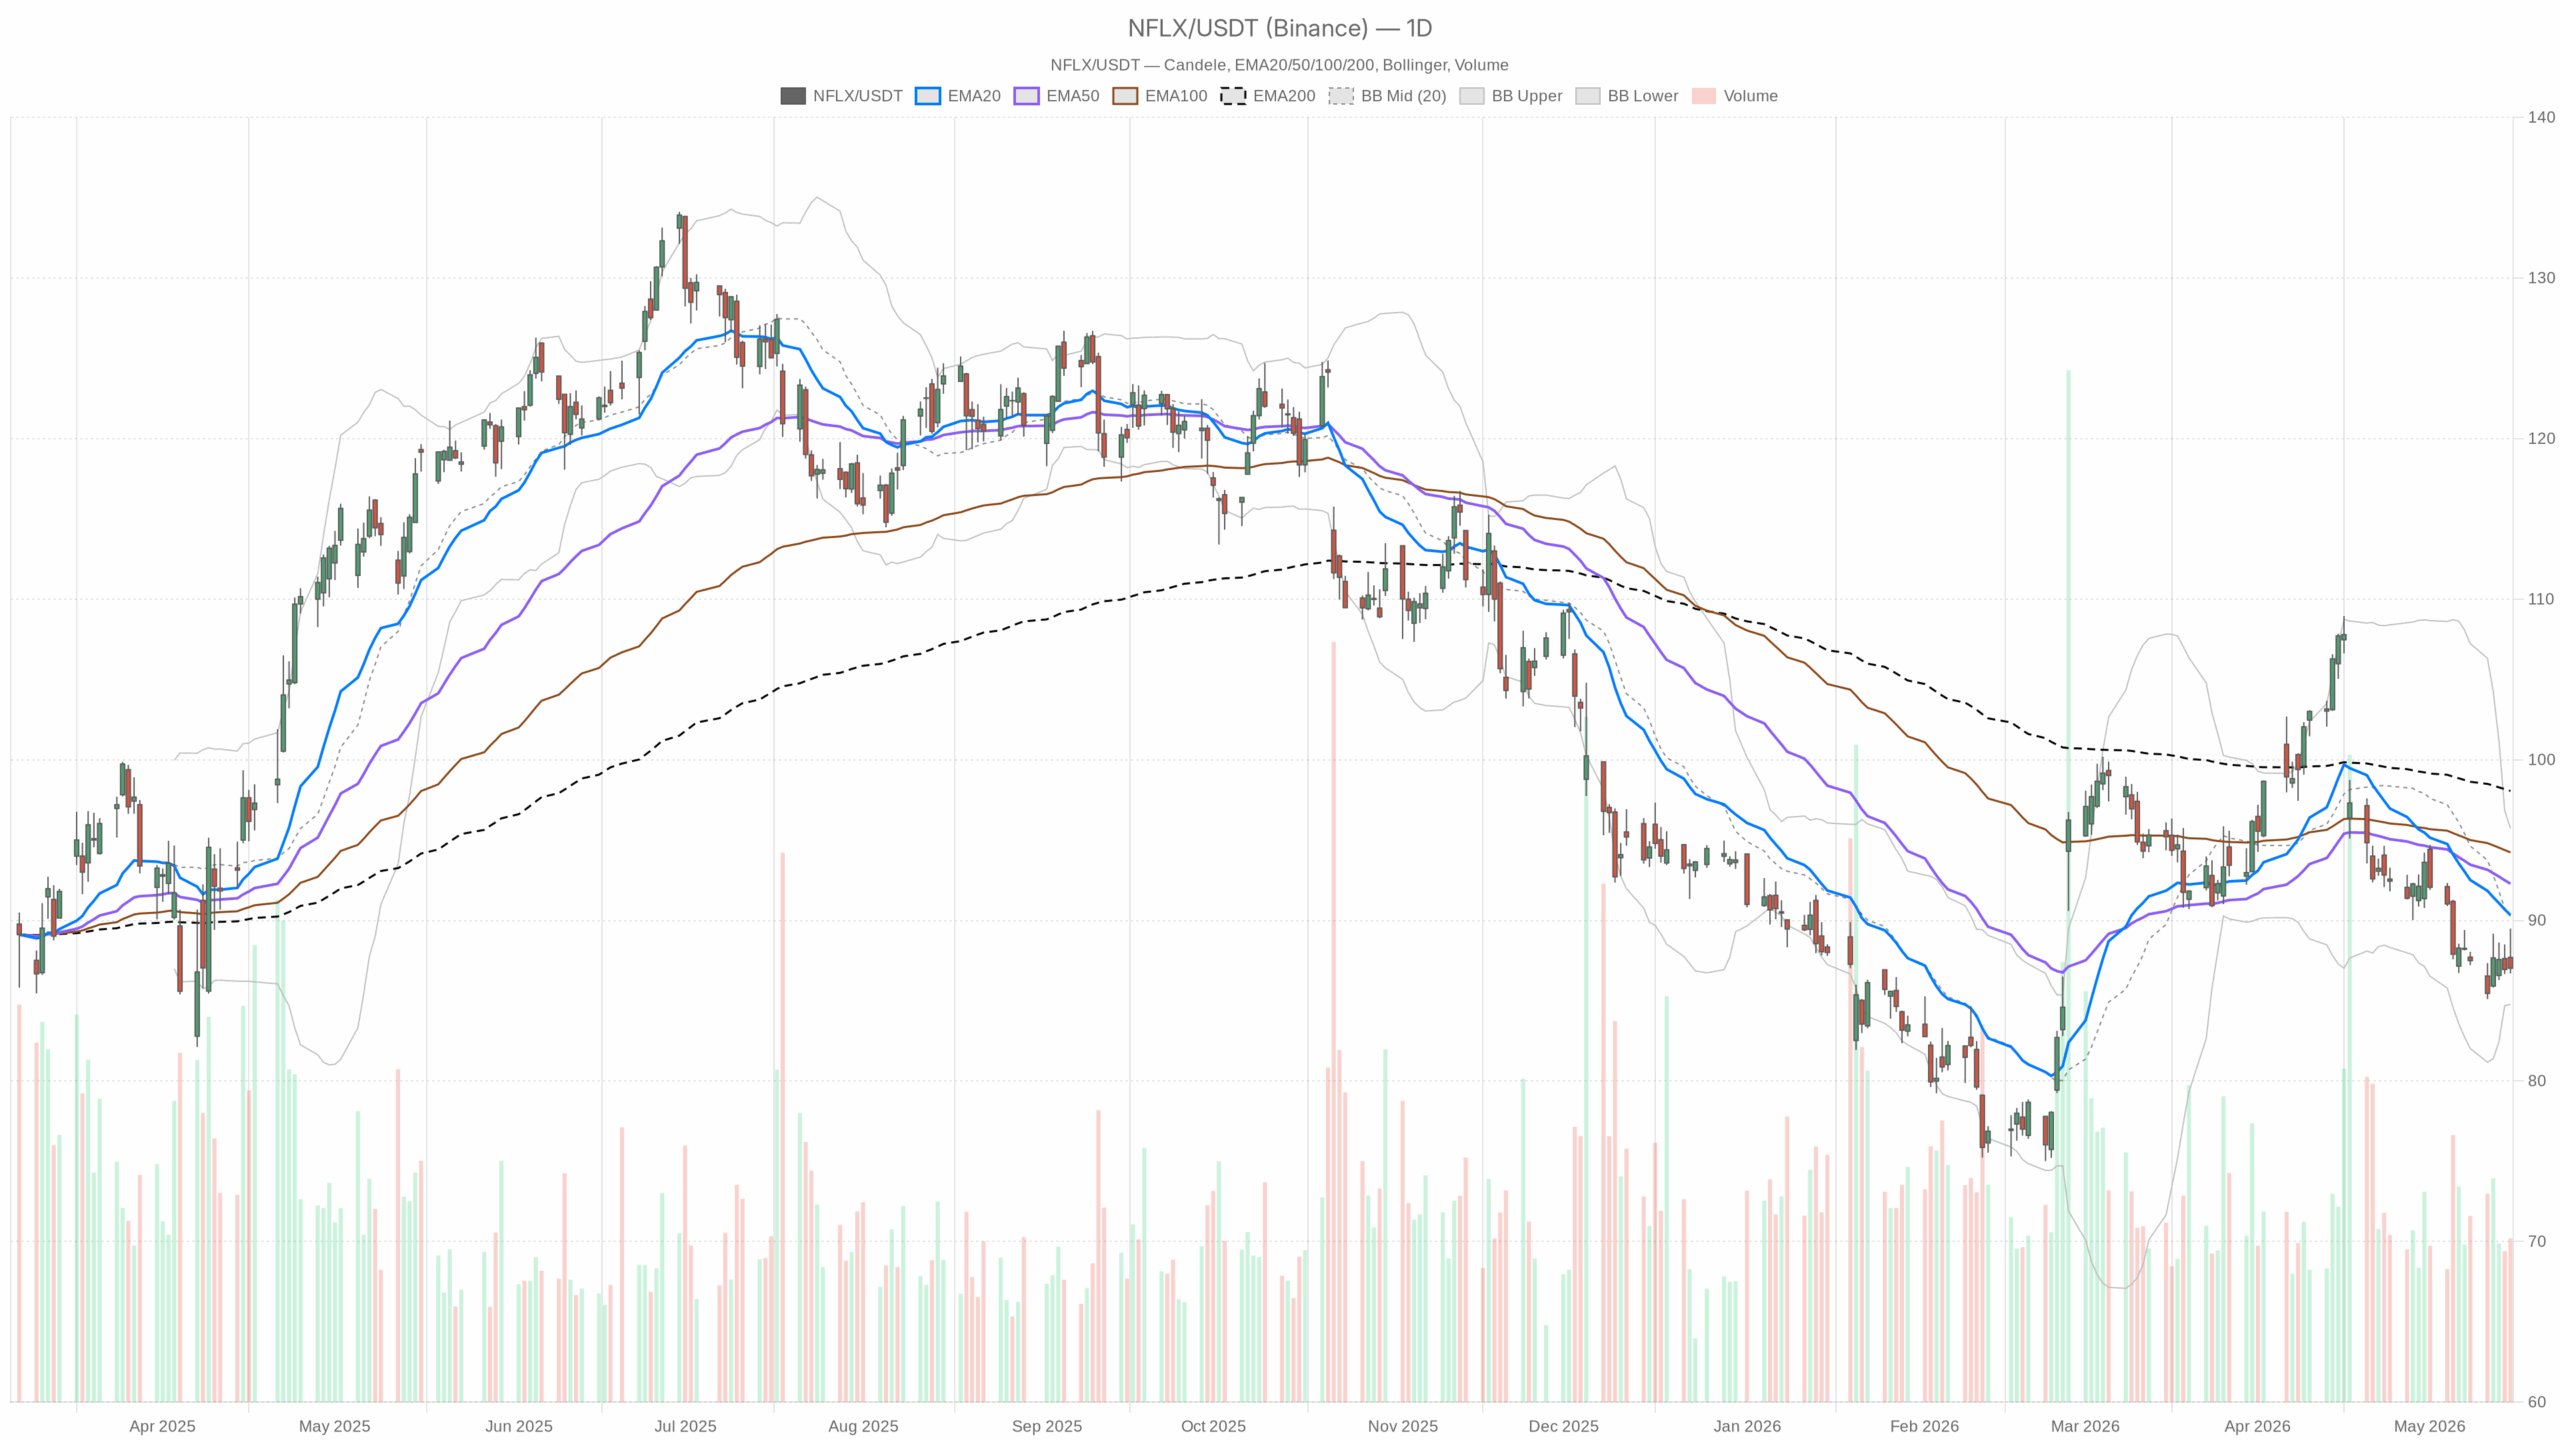 NFLX — daily chart with candlesticks, EMA20/EMA50 and volume.
Netflix Stock Daily Trend: Bearish Structure Intact
Daily Indicators, Volatility, and Levels
Friday’s close printed 87.02. The 20/50/200-day EMAs sit at 90.33/92.28/98.06. Trading below all three keeps the trend down and makes countertrend bounces suspect. RSI(14) is 36.73. Momentum remains weak but not capitulative. MACD shows a -2.42 line versus a -2.04 signal, with a -0.38 histogram. Bearish momentum is active and not inflecting yet.
Bollinger Bands put the mid-line at 90.24, the lower band at 84.76, and the upper at 95.73. Price below the mid-line and closer to the lower band reflects pressure, with room toward the mid-80s if sellers press. ATR(14) is 2.35. Daily ranges are moderate, so breakouts need commitment to extend. Daily pivot levels mark PP at 87.73, R1 at 88.78, and S1 at 85.98. Trading below the pivot tilts the session to sellers unless 87.73 is reclaimed.
Intraday Outlook: Hourly and 15-Minute for NFLX
Hourly Structure
Meanwhile, the hourly picture confirms a soft tone rather than a breakdown. The 1H close was 87.04 with EMA20/50/200 at 87.29/87.86/91.71. Sitting under the short and medium EMAs keeps intraday bias cautious and rebound attempts prone to supply. RSI(14) reads 45.93, which is neutral-to-soft.
MACD on 1H shows a -0.18 line versus a -0.13 signal and a -0.05 histogram. The bearish slope is mild and could flip with a small pop. Bollinger on 1H shows a mid at 87.41 with bands at 86.59–88.23. Price just below the mid-line signals a range with a slight downside lean. ATR(14) is 0.73, so expect sub-dollar swings absent a catalyst. Intraday pivot levels are PP 86.95, R1 87.22, S1 86.77.
15-Minute Context
At the same time, the 15-minute view provides execution context rather than a signal change. Price is 87.04 with EMA20/50/200 at 87.07/87.27/87.99. The very near-term trend is flat with light overhead friction. RSI(14) is 47.8 and balanced.
MACD shows a -0.14 line versus a -0.13 signal and a -0.01 histogram. Momentum is flat, so follow-through needs volume. Bollinger on 15m centers at 87.04 with bands 86.69–87.39. Sitting on the mid-line implies indecision. ATR(14) is 0.25, so scalps likely dominate until a level breaks. The 15m pivot map mirrors 1H at PP 86.95, R1 87.22, S1 86.77.
News Flow and Narrative for Netflix Stock
Notably, recent news has skewed constructive without changing the tape. Citi kept a Buy with a $115 objective, offering a supportive longer-term narrative if price reclaims resistance. Reports of faster ad-tier scaling and a KeyBanc nod on ad tech help the medium-term story. This builds confidence in revenue mix but has not yet turned momentum. Netflix’s AI INKubator adds an innovation angle that could aid content efficiency, though it remains a slower-burn driver rather than a near-term catalyst.
Scenarios and Trading Bias for Netflix Stock
Bullish Path
A firm hold above 86.95 on 1H, followed by a push through 87.22, would signal intraday control shifting to buyers. That setup would be reinforced by a daily close back over the 87.73 pivot.
A sustained break above 88.78 would open a run toward the Bollinger mid and EMA20 at 90.24/90.33. Regaining the daily mid-line would mark a tangible shift in balance. RSI crossing back through 50 on 1H and flattening higher on daily would validate a momentum turn. MACD stabilization with a positive 1H cross would add confirmation. Given a daily ATR of 2.35, a two-dollar move is plausible in a session or two if buyers gain initiative. Interpretation: bulls need layered confirmations and closes above the pivot stack to neutralize the downtrend.
Bearish Continuation
On the other hand, the bearish continuation becomes more likely on a clean break below 86.77 with follow-through under the daily S1 at 85.98. That sequence would put the 84.76 lower Bollinger band in play on the daily chart. RSI drifting toward 30 would reflect building downside pressure.
A widening negative MACD histogram on daily would indicate trend acceleration. On 1H, failure to reclaim the mid-band and a slide along the lower band would confirm control by sellers. With 1H ATR at 0.73, intraday air-pockets can open quickly once levels give way. Interpretation: losing 86.77 and then 85.98 would reassert the higher-timeframe downtrend and invite a test of the mid-80s.
Range-Bound Setup
In contrast, if price chops between 86.77 and 87.22, expect range trading to dominate into the next catalyst. The hourly structure and the 15m pivots argue for patience until a directional break occurs. Interpretation: neutrality intraday does not erase the daily bearish bias; it only delays resolution.
Consequently, positioning remains about respecting the daily downtrend while acknowledging tighter intraday ranges. Volatility is moderate across timeframes, so conviction moves should be visible through the pivot stack and the 20-day EMA. Uncertainty stems from whether improving ad economics and the AI pipeline can translate into sustained demand. Until the daily chart reclaims the 90 area, Netflix Stock carries a defensive bias with fade risk on rallies.


You May Also Like

Solana price confirms bearish crossover following Drift exploit, will it crash?

Evercore ISI S&P 500 Forecast 2026: Base Case 7,750, Bull Case 9,000


