

Be stock tests 271–273 support as daily uptrend stays intact

Be stock remains in a bullish daily trend, but Friday’s 275.95 close shifts focus to support. The thesis stands: the uptrend is intact, momentum has cooled, and 271–273 now matters. A swift reclaim of 279–285 would quickly put buyers back in control.
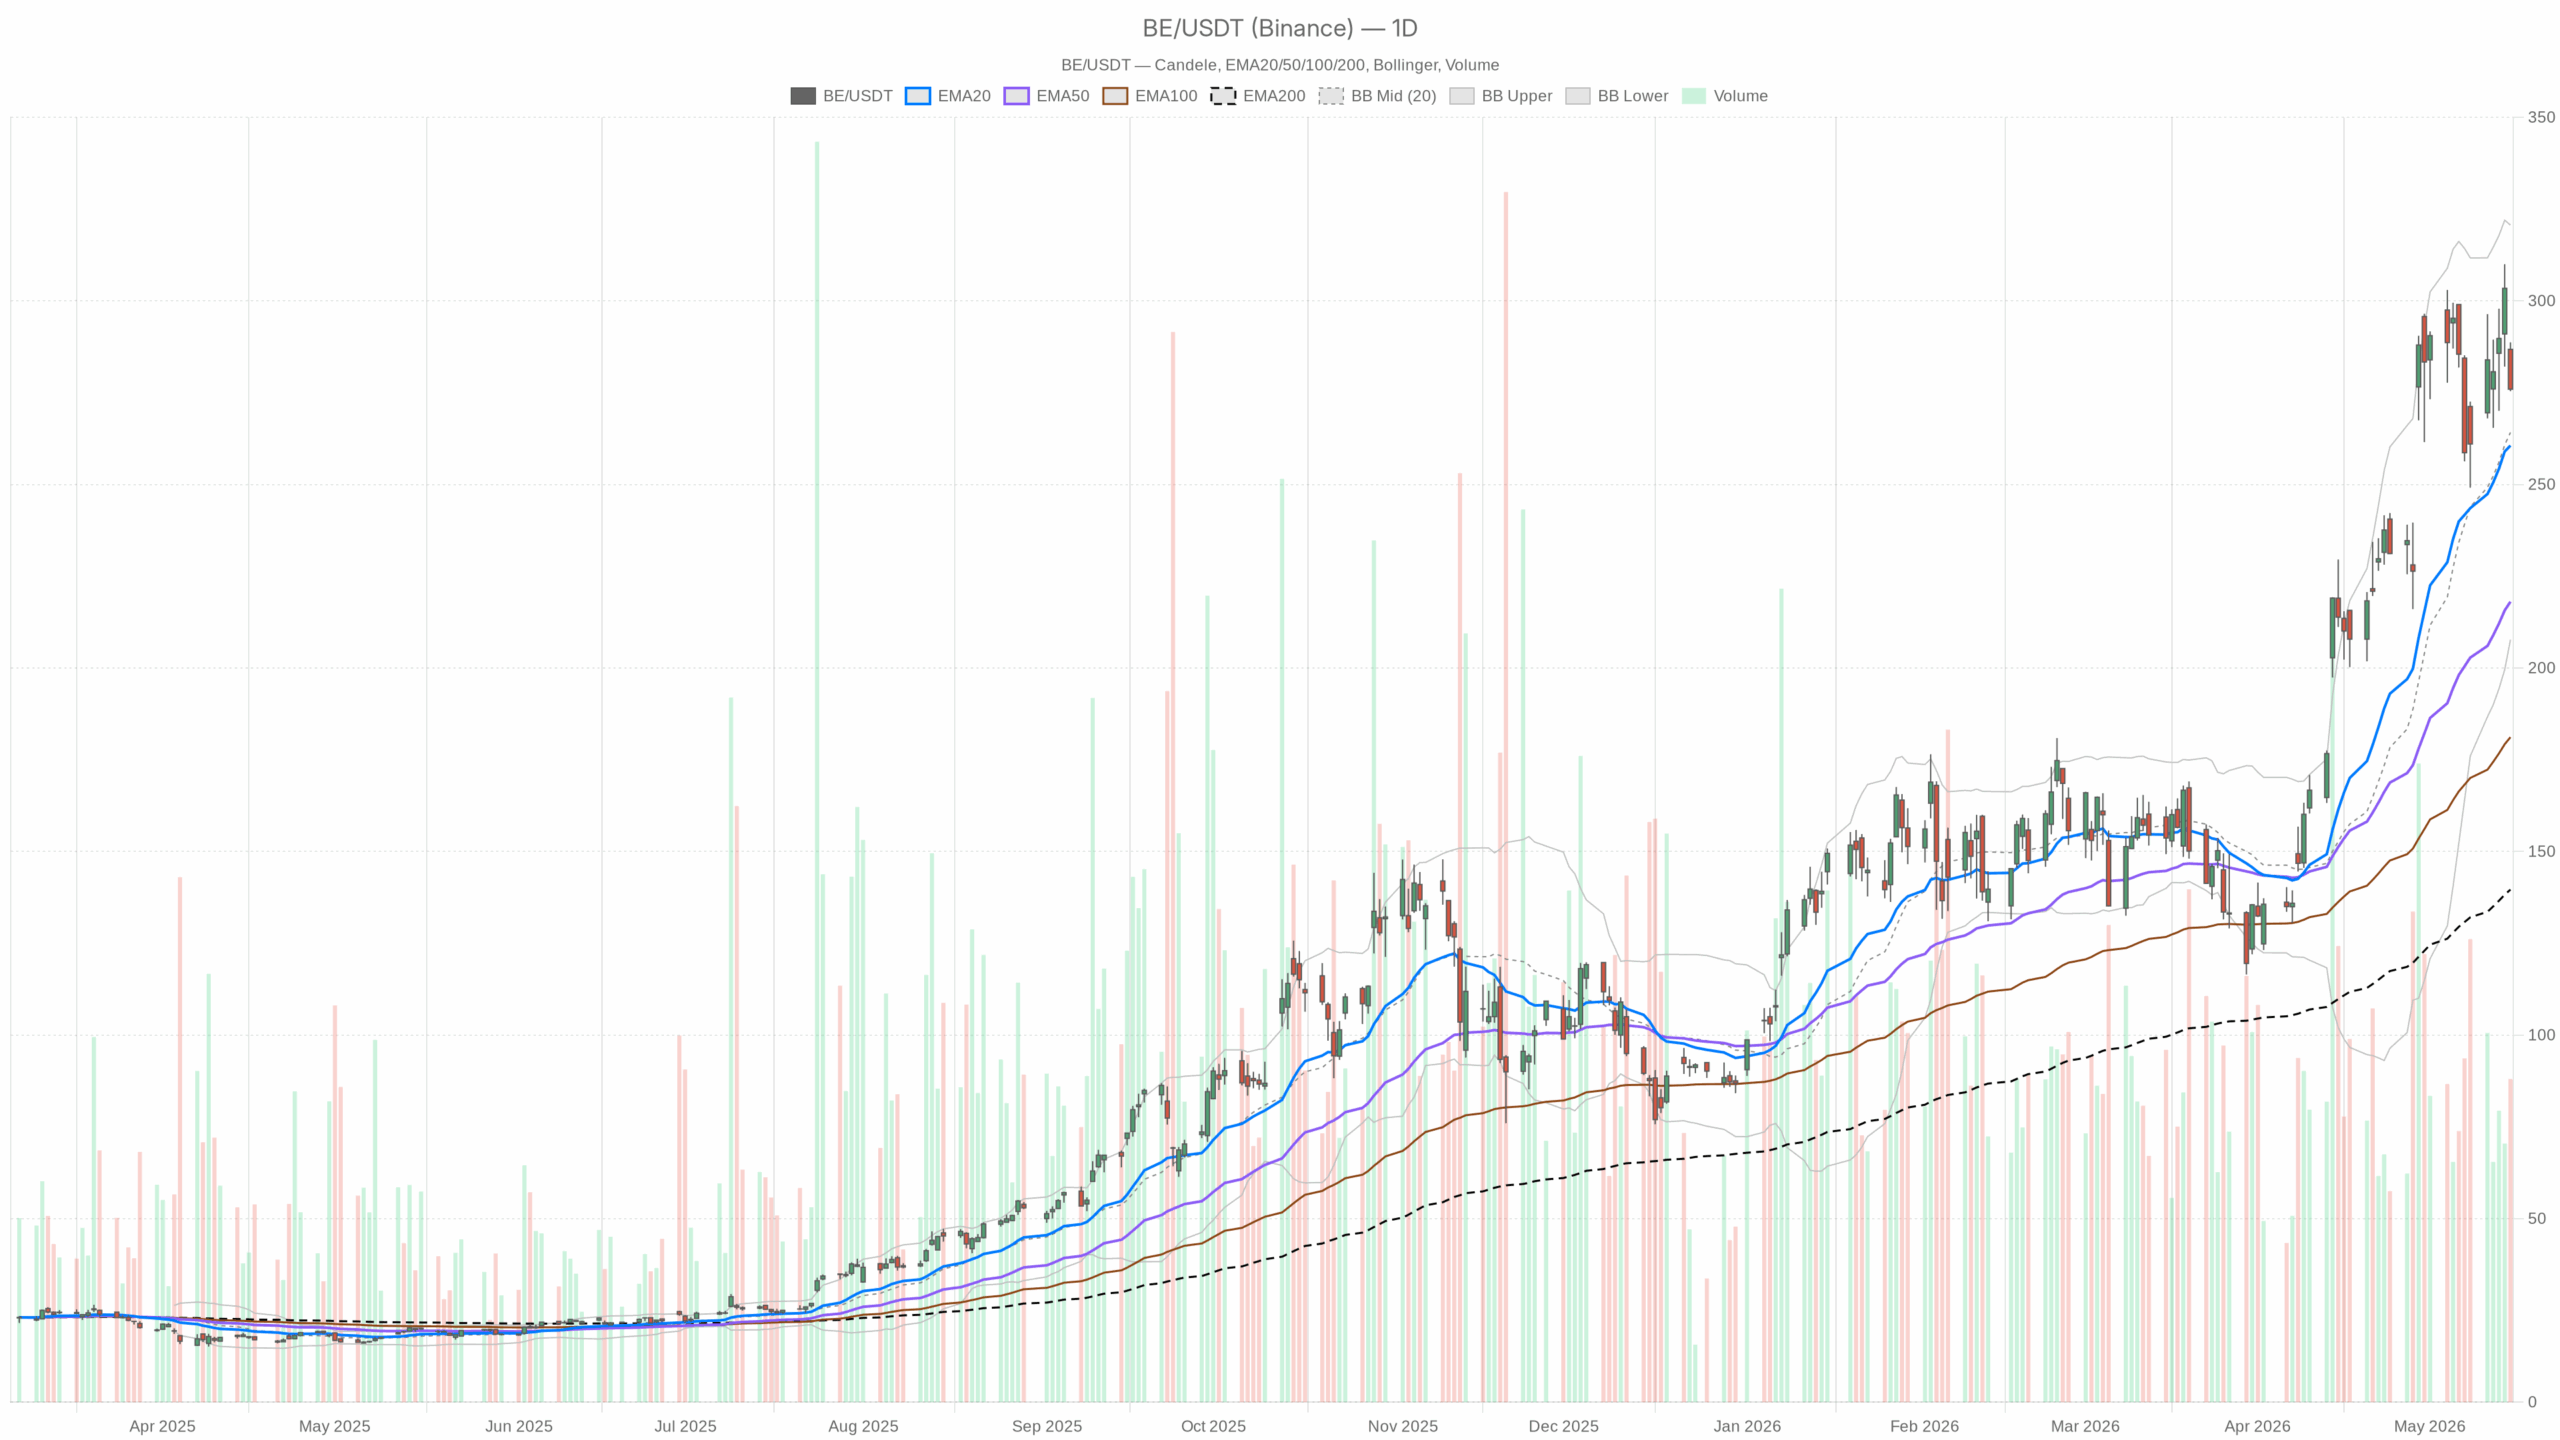 BE — daily chart with candlesticks, EMA20/EMA50 and volume.
Be stock sentiment: headline tailwind, technicals in charge
Notably, Bloom Energy appeared among the “10 Best Clean Energy Stocks to Buy Right Now.” That can bolster sentiment. However, the immediate tape for BE is being driven by technicals rather than headlines.
Daily chart: uptrend intact, momentum cools
On the daily chart, the EMA stack is positive with price above the 20-day EMA at 260.59, the 50-day at 218.05, and the 200-day at 139.62. This alignment confirms an established uptrend and healthy trend breadth for BE stock.
Moreover, daily RSI sits at 58.79. That is constructive and allows follow-through without being overbought. However, the daily MACD line (25.89) has slipped below its signal (27.77), leaving a small negative histogram of -1.88. Momentum has softened even as the broader trend stays positive.
Daily volatility and pivots
Meanwhile, price holds above the daily Bollinger mid-band at 264.17 with bands at 320.63 and 207.70. The location above the mid-band favors bulls, while the wide envelope reflects a broad trading range. Daily ATR14 is 27.99, indicating elevated volatility that can amplify swings.
In addition, the daily pivot framework shows a close just under the pivot point at 280.02 and above S1 at 271.33. Trading beneath PP tilts the very short-term tone cautious, while S1 marks the first meaningful support.
1-hour chart: pullback within the uptrend
On the 1-hour chart, the regime is neutral as price slipped below the EMA20 at 286.99 and the EMA50 at 283.56. This configuration confirms a pullback within the daily uptrend for BE.
Furthermore, the 1-hour RSI is 40.48. Momentum is subdued but not yet stretched to classic oversold. At the same time, the 1-hour MACD shows a negative histogram at -2.55 with the line (-0.67) below the signal (1.89). Intraday downside pressure remains in place.
Meanwhile, the 1-hour Bollinger mid sits at 291.47 with the lower band near 274.59. Price is hovering around that lower edge. Proximity to the lower band can precede a reflex bounce, but it also reflects persistent selling pressure. The 1-hour pivot is 279 with S1 at 273.19, placing near-term support in the 273 area.
15-minute chart: tactical stretch, bounce risk
In contrast, the 15-minute context shows tactical stretch. Price is below the 15-minute EMA20 at 283.78, EMA50 at 286.93, and EMA200 at 284.50. That intraday stack confirms a short-term downtrend.
Therefore, the 15-minute RSI at 33.39 is approaching oversold territory. Dip-buying attempts often emerge near these levels.
Additionally, the 15-minute MACD line (-2.13) remains below the signal (-2.25) while the histogram has turned slightly positive at 0.12. Downside momentum is easing at the margin. The 15-minute Bollinger mid is 282.17 with the lower band at 277.34, and price near 276–277 signals a possible mean-reversion window. ATR14 on 15-minute is 2.95, framing typical intraday swing size.
Scenarios for Be stock: key levels 271–273 and 279–285
Bullish scenario
Holding 271–273 (daily S1 at 271.33 and 1-hour S1 at 273.19) would keep the pullback orderly. A rebound over 279 (daily and 1-hour PP) would improve the tape, with follow-through through 282 and into the 283–287 band, where the 1-hour EMA50 (283.56) and EMA20 (286.99) sit. That sequence would reassert the daily uptrend on the BE chart.
Bearish scenario
On the other hand, a bearish turn emerges if 271–273 breaks and holds. Such a move would expose the daily Bollinger mid near 264.17 and then the rising daily EMA20 around 260.59. A failure to reclaim 279 afterward would invalidate the near-term bullish case.
Bottom line on Be stock
Overall, the daily bias for Be stock is still bullish, but the 1-hour softness complicates timing. Short-term conditions are stretched, which can fuel a reflex bounce, yet elevated ATR means swings can be sharp. Traders will likely key on 271–273 for support and 279–285 as the first upside test while monitoring RSI, MACD, and pivots for confirmation.


You May Also Like

Iran’s foreign minister targeted in assassination attempt, wife killed

HIVE Digital (HIVE) Stock Rockets 40% on C$3.5B AI Gigafactory Announcement in Toronto


