

Lockheed Martin stock faces resistance as rallies stall near $523

Lockheed Martin stock is attempting to stabilize after a sharp three‑month slide, but the daily trend remains pressured. With a May 15 close at 516.01 and rallies sold, the base case stays cautious bearish‑to‑neutral until price can reclaim nearby resistance.
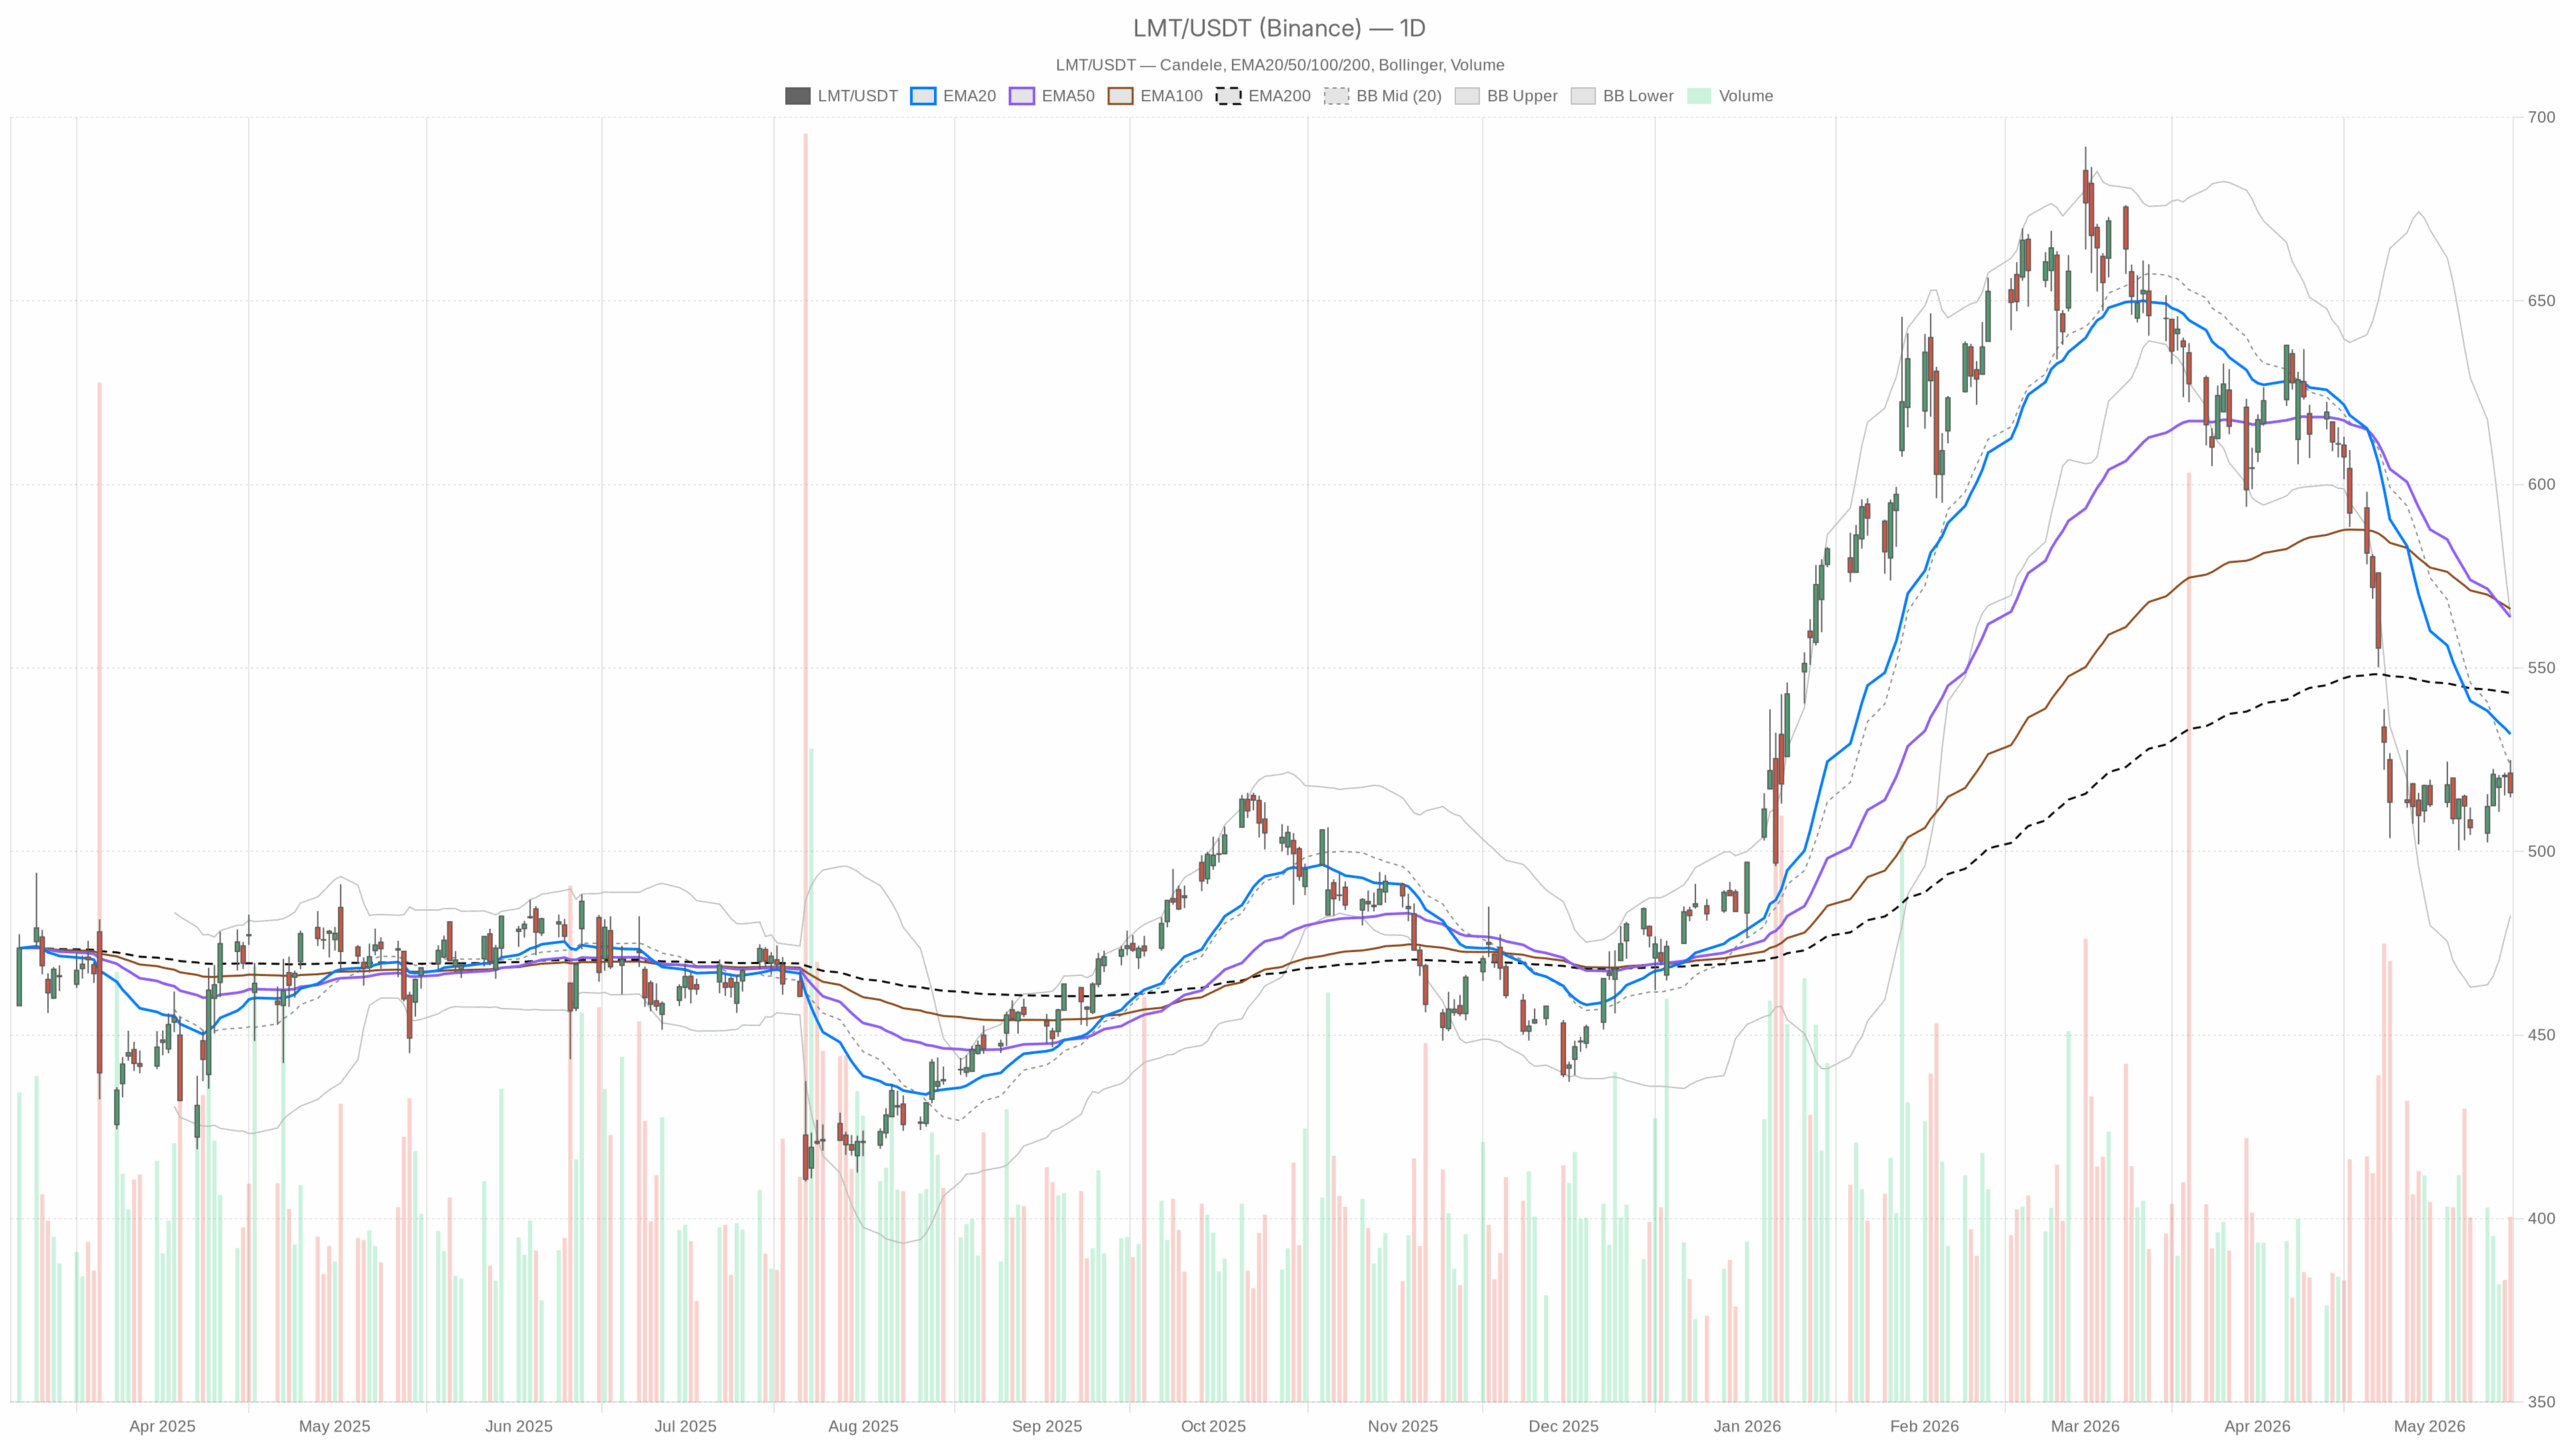 LMT — daily chart with candlesticks, EMA20/EMA50 and volume.
Headline context and positioning for Lockheed Martin stock
Fundamental overhangs
Notably, Jefferies trimmed its price target to 595 from 640 in late April. Recent pieces flagged margin headwinds linked to supply chains, tariffs, and rare earth constraints around the Strait of Hormuz—ongoing fundamental overhangs.
Counter‑trend supports
Meanwhile, Lockheed Martin appeared on “oversold” screens after roughly 16% one‑month and 21% three‑month drawdowns, and the company highlighted an integration milestone during the Balikatan 2026 exercise. In short, dip buyers exist, but the burden of proof sits with price.
Lockheed Martin stock daily outlook
Trend and moving averages
Daily timeframe (bias driver): LMT closed 516.01 versus the 20‑day EMA at 531.98, the 50‑day EMA at 563.82, and the 200‑day EMA at 543.15. Therefore, trading below all three keeps the trend skewed lower.
Momentum signals
The daily RSI14 stands at 34.1—weak momentum but not washed out. MACD is below zero with a positive histogram (line −20.49 vs signal −24.31; hist +3.82). Downside pressure is easing, but a trend reversal is unconfirmed.
Volatility and pivot map
Bollinger Bands center on 523.4 with a lower band at 482.52. Trading below the mid‑band suggests rallies can stall near 523–524. ATR14 is 10.9—daily range risk remains elevated. The daily pivot sits at 518.56 with R1 522.38 and S1 512.18. Therefore, 518–522 is a key near‑term battleground.
Intraday structure: hourly and 15‑minute for LMT
Hourly tone remains defensive
On the 1H chart, price is 516.08 with the 20‑EMA at 517.49 and the 50‑EMA at 516.58—both marginally above price, implying light intraday supply. RSI14 is 46.54—neutral‑to‑soft. MACD sits near flat with a negative histogram (0.23 vs 0.92; hist −0.69)—momentum is lacking.
The Bollinger mid is 518.38 with a lower band at 515.30. Price hugging the lower band points to a defensive intraday posture. ATR14 is 3.09—intraday ranges are contained but tradable. The hourly pivot is 515.76 with R1 516.79 and S1 515.04. Micro support and resistance are tightly stacked, reinforcing chop.
15‑minute execution stays compact
Price at 516.08 sits below the 15m 20‑EMA (516.61) and 50‑EMA (517.38) but above the 200‑EMA (515.49). This reflects short‑term pressure with a nearby longer‑term intraday base. RSI14 is 45.25—sub‑50 and cautious. MACD is essentially flat (−0.64 vs −0.65; hist +0.01)—no clear impulse.
The Bollinger mid is 516.52 with bands 514.85–518.19. Bands remain tight, signaling short‑term indecision. ATR14 is 1.14—the scalpers’ range is narrow around the pivot band.
Alignment across timeframes and one constructive tell
Therefore, the timeframes are broadly aligned in a soft posture: the daily bias is bearish‑to‑neutral, the hourly tone is defensive, and the 15‑minute shows tight, hesitant trade. The one constructive tell is the daily MACD histogram turning positive while still sub‑zero—an early sign of fading downside pressure.
In contrast, intraday EMAs overhead argue that bounces may falter near 517–518 unless buyers press with energy.
Key levels for Lockheed Martin stock today
S1 512.18 on the daily is the first downside reference, with the daily pivot at 518.56 and R1 522.38 overhead. Notably, the daily Bollinger mid sits at 523.4—reclaiming and holding above it would mark the first step toward repair.
Conversely, a clean break below 512 on a closing basis would leave price vulnerable to a one‑ATR extension toward the low‑505s, with the daily lower band at 482.5 a more distant, stress‑test level.
Scenarios for Lockheed Martin stock
Bullish scenario
A sustained push back over 522–523 that also lifts the 1H close above the 20‑EMA (now ~517.5) and Bollinger mid (518.4) would strengthen a basing case—clearing nearby supply and showing follow‑through. On the daily, a close back above the 20‑EMA at ~532 would be more decisive—regaining trend control.
RSI would likely reclaim 50 on intraday charts, turning momentum constructive. A 1H MACD cross‑up with a widening positive histogram would add confirmation—buyers in control of the tape rather than just short covering.
Bearish scenario (and bullish invalidation)
Failure to retake 518–523, coupled with repeated rejections near 522–523, would keep rallies capped. A break and close below 512 would open room toward an ATR move near 505—a downside extension in line with current volatility.
On the daily, RSI pressing into the low‑30s and the MACD histogram rolling back negative would confirm momentum re‑acceleration. In that case, the bullish repair path is invalid until price can reclaim the daily mid‑band near 523 and, preferably, the 20‑EMA near 532.
Catalysts and risk management
At the same time, fundamentals remain a two‑way catalyst. Margin pressure headlines can weigh on multiples, while “oversold” screens and operational wins can spark counter‑trend bids. Overall, positioning into 522–532 looks heavy with supply, and 512 is the near‑term line of defense.
Meanwhile, volatility, as measured by ATR, argues for disciplined risk sizing while the market decides whether this is a base or a staging area for another leg down in Lockheed Martin stock.


You May Also Like

Iran’s foreign minister targeted in assassination attempt, wife killed

HIVE Digital (HIVE) Stock Rockets 40% on C$3.5B AI Gigafactory Announcement in Toronto


