TLDR Solana price holds key $124–$125 support after a sharp decline from recent highs. 4H charts show accumulation signs as repeated sell-offs fail to extend lowerTLDR Solana price holds key $124–$125 support after a sharp decline from recent highs. 4H charts show accumulation signs as repeated sell-offs fail to extend lower

Solana Price Analysis: Accumulation Builds as SOL Defends Key Support

TLDR

  • Solana price holds key $124–$125 support after a sharp decline from recent highs.
  • 4H charts show accumulation signs as repeated sell-offs fail to extend lower.
  • Short-term structure remains weak below $129, now acting as resistance.
  • A breakout above $145 could signal recovery, while a drop below $125 risks $120.

Solana (SOL) is currently trading near the mid-$120s after a sharp decline from recent highs, with price action showing mixed signals across timeframes. While the broader short-term trend remains cautious to bearish following multiple breakdowns, the market is also displaying signs of stabilization near a historically important demand zone.

The $124–$125 support has emerged as the most critical level in play, while resistance is layered between $129 and the $139–$145 supply zone.

Solana Price Consolidates Amid Accumulation Signals

According to analyst Ninja, the 4-hour chart indicates Solana price has transitioned from an impulsive decline into a structured consolidation range. Price has repeatedly respected resistance near $144–$145 while holding support around $123–$125. This behavior suggests selling pressure has eased, allowing demand to absorb supply within a defined range.

ImageSOURCE: X

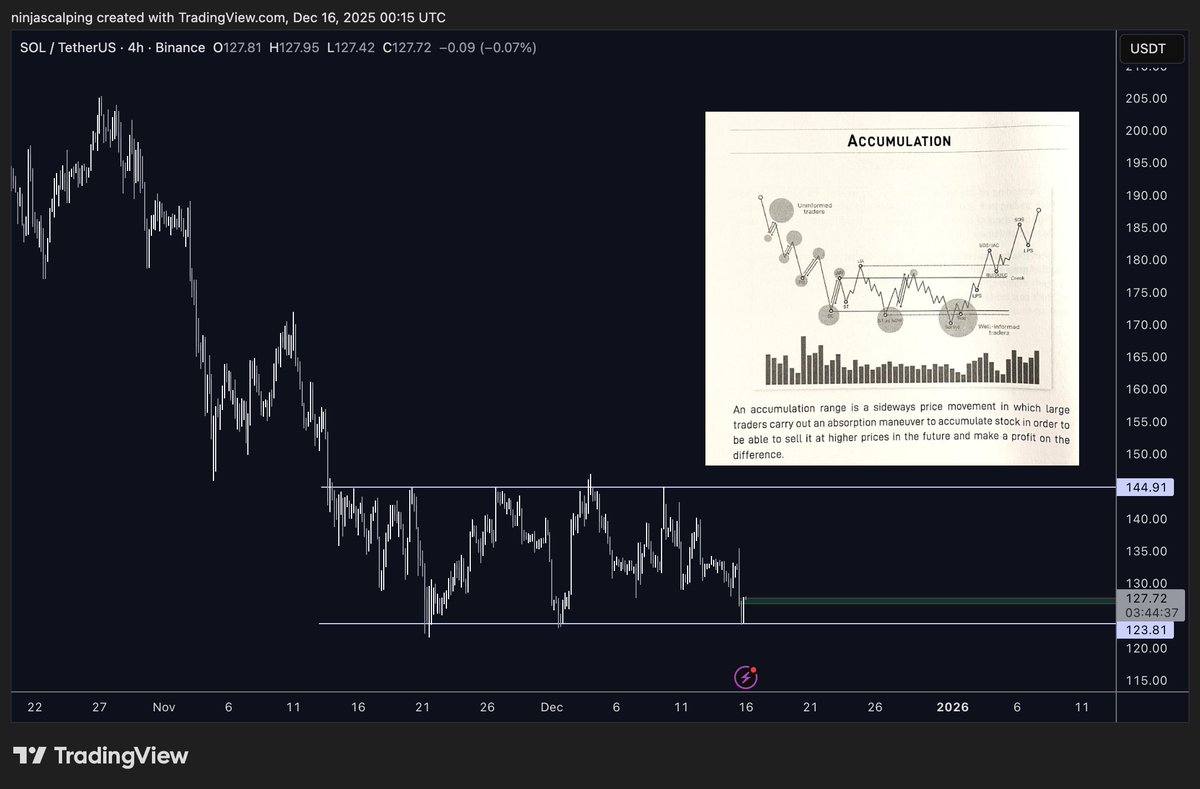
Additionally, repeated downside probes below support have failed to trigger sustained follow-through. Each dip has been met with swift recoveries back into the range, signaling responsive buying interest. From a market structure standpoint, this pattern aligns with early accumulation dynamics, where volatility compresses ahead of a potential expansion. A confirmed breakout above $145 would strengthen the bullish case.

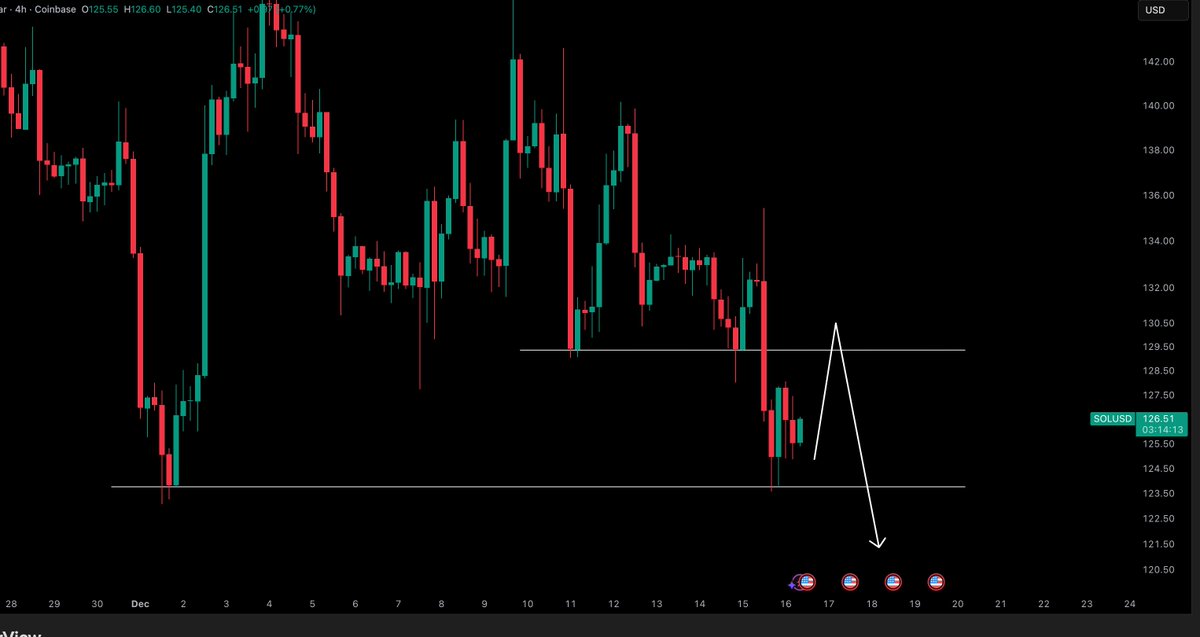
Rejection Reinforces Near-Term Caution

Meanwhile, short-term structure reflects lingering weakness. Analysis from KNIGHT highlights a clear rejection from the $139–$141 supply zone on the 1-hour chart. Multiple failures at this level absorbed buy-side liquidity and preceded a decisive breakdown, reinforcing the view that sellers remain active at higher prices.

Once SOL lost the $133–$134 level, downside momentum accelerated toward $125. The sharp wick near the lows suggests a liquidity sweep rather than orderly selling. While a modest rebound toward $126–$128 is underway, it lacks volume confirmation.

As long as SOL price remains below reclaimed resistance, the bounce remains corrective within a broader consolidation.

Solana Price Faces Key Retest Risk Near $129

According to analyst Crypto Tony, Solana price remains technically vulnerable after losing the $129 level, which previously acted as short-term demand. The 4-hour chart shows that this level now functions as potential resistance. A failed retest of $129 would confirm a bearish flip and increase downside risk.

ImageSOURCE: X

On the lower end, support near $124–$125 remains pivotal. A clean break below this zone could expose SOL to a deeper move toward the $120 psychological level. Until price can reclaim $129 with strong follow-through, rallies are viewed cautiously. Market structure remains mixed, with accumulation signals offset by unresolved overhead supply.

Therefore, Solana price is holding a critical support zone while broader consolidation develops. A sustained move above $145 would favor recovery, while failure below $125 risks renewed downside pressure.

The post Solana Price Analysis: Accumulation Builds as SOL Defends Key Support appeared first on CoinCentral.

Market Opportunity
Solana Logo
Solana Price(SOL)
$127.29
$127.29$127.29
-1.88%
USD
Solana (SOL) Live Price Chart
Disclaimer: The articles reposted on this site are sourced from public platforms and are provided for informational purposes only. They do not necessarily reflect the views of MEXC. All rights remain with the original authors. If you believe any content infringes on third-party rights, please contact service@support.mexc.com for removal. MEXC makes no guarantees regarding the accuracy, completeness, or timeliness of the content and is not responsible for any actions taken based on the information provided. The content does not constitute financial, legal, or other professional advice, nor should it be considered a recommendation or endorsement by MEXC.

You May Also Like

Shiba Inu (SHIB) vs Little Pepe (LILPEPE): Which Meme Coin Will Take the Crown from Dogecoin (DOGE)?

Shiba Inu (SHIB) vs Little Pepe (LILPEPE): Which Meme Coin Will Take the Crown from Dogecoin (DOGE)?

The post Shiba Inu (SHIB) vs Little Pepe (LILPEPE): Which Meme Coin Will Take the Crown from Dogecoin (DOGE)? appeared on BitcoinEthereumNews.com. Dogecoin has been the face of meme coins for a long time. From Elon Musk tweets to a robust community, DOGE has managed to stay alive. But in 2025, things appear slightly different. Will Shiba Inu keep pursuing Dogecoin, or will new contender Little Pepe pass them both by? Dogecoin (DOGE): Still the Benchmark Dogecoin is trading just above $0.2452, up 10.63% over the past week. That steady climb shows why DOGE still matters: it has the liquidity, the listings, and the recognition that few meme tokens can match. Analysts see its price grinding higher into year-end, supported by altcoin momentum and ETF launches in the U.S. But here’s the thing: DOGE is no longer a scrappy underdog. With a market cap already in the tens of billions, turning $100 into $10,000 here is nearly impossible. It’s the Bitcoin of meme coins: reliable, liquid, and still iconic, but its days of 1,000× gains are behind it. Shiba Inu (SHIB): Big Name, Slowing Engine Shiba Inu sits at $0.00001349 with a market cap of $7.6 billion. It’s clawed back momentum with a 3.98% monthly surge, and analysts project a further 9.26% weekly gain to $0.00001418. Token burns and the expansion of Shibarium, its Layer-2 solution, keep the ecosystem alive. That said, SHIB’s size is also its weakness. Even with whales accumulating another 62 billion tokens, growth projections hover in the 400%–500% range, which is impressive but pales in comparison to what early buyers saw in 2021. SHIB is in the odd position of being too big to vanish, but too large to repeat its breakout magic. Little Pepe (LILPEPE): The New Challenger SHIB grew on pure hype, but LILPEPE comes with real infrastructure. The project is building an Ethereum-compatible Layer-2 network designed for meme tokens, with near-zero fees, sniper-bot resistance, and…
Share
BitcoinEthereumNews2025/10/04 23:32
Kodiak Sciences Announces Pricing of Upsized Public Offering of Common Stock

Kodiak Sciences Announces Pricing of Upsized Public Offering of Common Stock

PALO ALTO, Calif., Dec. 16, 2025 /PRNewswire/ — Kodiak Sciences Inc. (Nasdaq: KOD), a precommercial retina focused biotechnology company committed to researching
Share
AI Journal2025/12/17 12:15
Oil jumps over 1% on Venezuela oil blockade

Oil jumps over 1% on Venezuela oil blockade

Oil prices rose more than 1 percent on Wednesday after US President Donald Trump ordered “a total and complete” blockade of all sanctioned oil tankers entering
Share
Agbi2025/12/17 11:55