A weakening U.S. dollar is opening the door for a possible new surge in Bitcoin, stirring questions about whether one of finance’s most familiar patterns is about to play out again. That’s the view in a July 9 analysis shared…A weakening U.S. dollar is opening the door for a possible new surge in Bitcoin, stirring questions about whether one of finance’s most familiar patterns is about to play out again. That’s the view in a July 9 analysis shared…

Bitcoin eyes gains as dollar index sinks to 21-year lows — Can BTC surge past all-time high?

2025/07/09 17:20
3 min read
For feedback or concerns regarding this content, please contact us at crypto.news@mexc.com

A weakening U.S. dollar is opening the door for a possible new surge in Bitcoin, stirring questions about whether one of finance’s most familiar patterns is about to play out again.

That’s the view in a July 9 analysis shared by CryptoQuant contributor Darkfost, who points out that the U.S. Dollar Index has dropped to a historically weak level. It’s now sitting 6.5 points under its 200-day moving average, the largest gap seen in more than 21 years.

Some traditional markets may be concerned about this, but history shows that a declining dollar often creates an environment that is favorable for risky assets like Bitcoin (BTC). As traders move their money to assets that might hold value better during currency stress, Bitcoin has frequently increased in value.

For instance, when the DXY surged to a 20-year high of 114 in 2022, Bitcoin fell to roughly $16,000, but it bounced back above $40,000 when the dollar fell in late 2023. This trend has repeatedly occurred since 2015, with Bitcoin’s correlation to the dollar index typically ranging from -0.4 to -0.8.

Despite this backdrop, Bitcoin’s price hasn’t broken out just yet. At the time of writing, Bitcoin trades at $108,712, a small increase of 0.2% in the past 24 hours. It’s still only about 2.7% below its all-time high of $111,814 set on May 22. With volume dropping 18% in a single day to about $21.5 billion, trading activity has cooled off. 

The derivatives markets have also seen a slowdown in activity, as per data from Coinglass. Open interest has dipped slightly to $73.41 billion, while derivatives trading volume has decreased by roughly 12% to $55.3 billion. This implies that despite the dollar’s decline, traders are still being cautious for the time being.

On the technical side, Bitcoin’s signals are mixed. The market is neither significantly overbought nor oversold, according to the relative strength index, which is neutral at 56. Although the momentum indicator itself has entered negative territory, suggesting short-term hesitation, the MACD has turned positive, indicating some upward momentum is building.

Bitcoin eyes gains as dollar index sinks to 21-year lows — Can BTC surge past all-time high? - 1

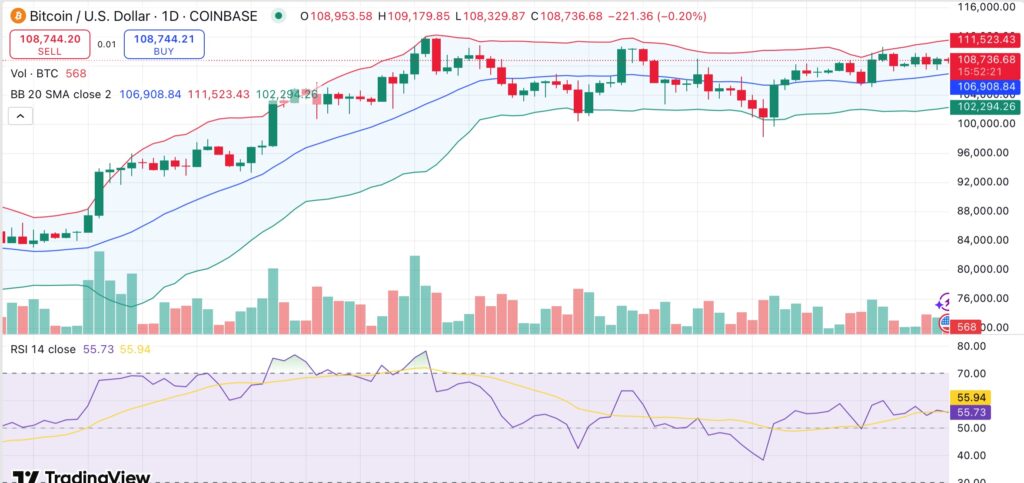
Bitcoin is currently trading above all of its major moving averages, which typically denotes an overall upward trend and implies that any declines may quickly find support. A slight widening of the Bollinger Bands suggests that price volatility may increase soon.

Traders are keeping an eye on whether Bitcoin can break through resistance at $110,300 or if it will drop below support at $107,100. For the time being, the declining dollar creates favorable conditions for a possible Bitcoin rally. However, the speed at which traders take action may determine whether history repeats itself.

Market Opportunity
Bitcoin Logo
Bitcoin Price(BTC)
$68,604.68
$68,604.68$68,604.68
-1.94%
USD
Bitcoin (BTC) Live Price Chart
Disclaimer: The articles reposted on this site are sourced from public platforms and are provided for informational purposes only. They do not necessarily reflect the views of MEXC. All rights remain with the original authors. If you believe any content infringes on third-party rights, please contact crypto.news@mexc.com for removal. MEXC makes no guarantees regarding the accuracy, completeness, or timeliness of the content and is not responsible for any actions taken based on the information provided. The content does not constitute financial, legal, or other professional advice, nor should it be considered a recommendation or endorsement by MEXC.

You May Also Like

Riot Sells 500 BTC for $34.87 Million

Riot Sells 500 BTC for $34.87 Million

Riot Platforms has sold another 500 BTC worth approximately $34.87 million, bringing its total sales to 1,500 BTC—over $102 million—in just five days. Moves of
Share
Coinfomania2026/04/07 19:02
Edges higher ahead of BoC-Fed policy outcome

Edges higher ahead of BoC-Fed policy outcome

The post Edges higher ahead of BoC-Fed policy outcome appeared on BitcoinEthereumNews.com. USD/CAD gains marginally to near 1.3760 ahead of monetary policy announcements by the Fed and the BoC. Both the Fed and the BoC are expected to lower interest rates. USD/CAD forms a Head and Shoulder chart pattern. The USD/CAD pair ticks up to near 1.3760 during the late European session on Wednesday. The Loonie pair gains marginally ahead of monetary policy outcomes by the Bank of Canada (BoC) and the Federal Reserve (Fed) during New York trading hours. Both the BoC and the Fed are expected to cut interest rates amid mounting labor market conditions in their respective economies. Inflationary pressures in the Canadian economy have cooled down, emerging as another reason behind the BoC’s dovish expectations. However, the Fed is expected to start the monetary-easing campaign despite the United States (US) inflation remaining higher. Investors will closely monitor press conferences from both Fed Chair Jerome Powell and BoC Governor Tiff Macklem to get cues about whether there will be more interest rate cuts in the remainder of the year. According to analysts from Barclays, the Fed’s latest median projections for interest rates are likely to call for three interest rate cuts by 2025. Ahead of the Fed’s monetary policy, the US Dollar Index (DXY), which tracks the Greenback’s value against six major currencies, holds onto Tuesday’s losses near 96.60. USD/CAD forms a Head and Shoulder chart pattern, which indicates a bearish reversal. The neckline of the above-mentioned chart pattern is plotted near 1.3715. The near-term trend of the pair remains bearish as it stays below the 20-day Exponential Moving Average (EMA), which trades around 1.3800. The 14-day Relative Strength Index (RSI) slides to near 40.00. A fresh bearish momentum would emerge if the RSI falls below that level. Going forward, the asset could slide towards the round level of…
Share
BitcoinEthereumNews2025/09/18 01:23
Polymarket Expands Into Stocks and Commodities With Pyth-Powered Pricing

Polymarket Expands Into Stocks and Commodities With Pyth-Powered Pricing

Polymarket launched daily equity and commodity markets powered by Pyth Network's real-time price feeds, expanding prediction trading into traditional finance. The
Share
Cryptonews AU2026/04/03 13:52

$30,000 in PRL + 15,000 USDT

$30,000 in PRL + 15,000 USDT$30,000 in PRL + 15,000 USDT

Deposit & trade PRL to boost your rewards!