After a positive start to the year, Bitcoin’s upside momentum has taken a noticeable correction over the past two days. BTC attempted a break above the decisiveAfter a positive start to the year, Bitcoin’s upside momentum has taken a noticeable correction over the past two days. BTC attempted a break above the decisive

If Bitcoin Doesn’t Move Soon, the Next Move Could Matter More

After a positive start to the year, Bitcoin’s upside momentum has taken a noticeable correction over the past two days. BTC attempted a break above the decisive level of $95K on January 14th but has since seen six consecutive red days, pulling back around 7% since the local high of $97,900. 

Approximately $100 billion has been wiped out from the total crypto market cap across the last 48 hours. The altcoin marketcap, measured by the TOTAL2 excluding stablecoin chart, also experienced declines of roughly 3.5% over the same period. 

After failing to reclaim the $95K level on the weekly timeframe, BTC is now back within the consolidation range it’s been in since mid November. Should downside pressure accelerate, attention shifts to key support levels that need to hold to preserve the broader long-term market structure. 

What Caused the Selloff? 

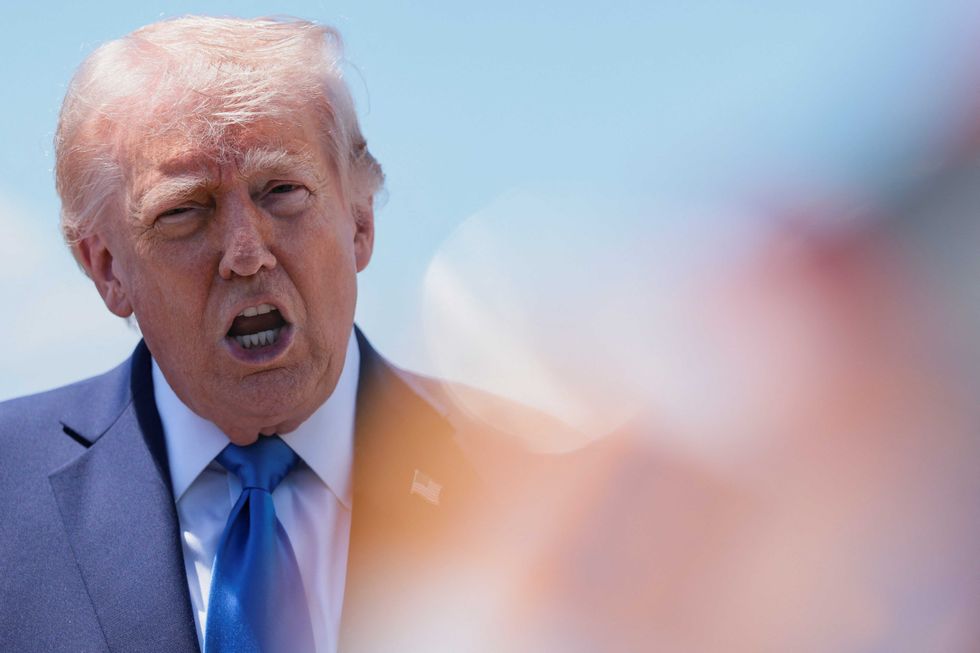
The selloff was largely triggered by macro uncertainties around Trump’s renewed push to annex the arctic island of Greenland coupled with threats of broad tariffs on eight European countries until what he described as a complete and total purchase is negotiated. While these developments remain highly speculative and politically charged, such headlines increase uncertainty around global trade tensions and diplomacy. 

As a result, investors have moved to de-risk their portfolios, rotating out of assets like BTC in favor of safer positioning. This risk-off rotation is reflected in the strong outperformance of commodities like gold and silver, which are currently trading at all-time highs and have gained 9.59% and 31% YTD, respectively. 

Key Levels to Watch 

The first key level for BTC to hold and where many traders potentially could position themselves for a bounce opportunity is at the 50 day Simple Moving Average (SMA). This currently sits at $90,400 and is in confluence with an ascending trendline that dates back to the lows of $80.5K recorded in November last year. 

Beyond the 50-day SMA, attention shifts to the yearly open near $87.5K, which aligns with the 0.5 Fibonacci retracement. Just below this, the Fibonacci golden pocket (~$86K) represents a key zone that needs to hold to preserve the broader consolidation structure. 

What Could Confirm the Next Move

Beyond price levels, confirmation of the next directional move will require a pickup in volume. Aggregated daily exchange volume has tapered off since January 16th, signaling reduced conviction behind the recent price action. The diminishing volume suggests that we are seeing a market that is currently correcting on thinning liquidity rather than strong directional intent. Therefore, for any sustained trend, up or down, volume needs to expand, as low volume moves tend to be fragile and prone to reversals rather than continuation.  

Looking ahead, institutional participation and activity could be a key variable to watch. With U.S. markets closed yesterday, BTC spot ETF flows in the coming week will provide a clearer insight into whether institutional demand can offset the recent selling pressure or amplify it. Ultimately, the current backdrop largely hinges upon broader macro developments. As geopolitical rhetoric and trade-related uncertainties continue to shape risk appetite, BTC’s next move is likely to be driven as much by macro signals as by technical levels, making the coming week particularly pivotal for market direction. 

Market Opportunity
Movement Logo
Movement Price(MOVE)
$0.03404
$0.03404$0.03404
-6.07%
USD
Movement (MOVE) Live Price Chart
Disclaimer: The articles reposted on this site are sourced from public platforms and are provided for informational purposes only. They do not necessarily reflect the views of MEXC. All rights remain with the original authors. If you believe any content infringes on third-party rights, please contact service@support.mexc.com for removal. MEXC makes no guarantees regarding the accuracy, completeness, or timeliness of the content and is not responsible for any actions taken based on the information provided. The content does not constitute financial, legal, or other professional advice, nor should it be considered a recommendation or endorsement by MEXC.

You May Also Like

Why Bitcoin’s Bear Case Is Suddenly Back on the Table

Why Bitcoin’s Bear Case Is Suddenly Back on the Table

Fear, Liquidity, and Market Structure Collide at a Critical Moment Bitcoin has spent most of January 2026 trading under pressure, slipping below key psycho
Share
Medium2026/01/20 20:55
Microsoft Corp. $MSFT blue box area offers a buying opportunity

Microsoft Corp. $MSFT blue box area offers a buying opportunity

The post Microsoft Corp. $MSFT blue box area offers a buying opportunity appeared on BitcoinEthereumNews.com. In today’s article, we’ll examine the recent performance of Microsoft Corp. ($MSFT) through the lens of Elliott Wave Theory. We’ll review how the rally from the April 07, 2025 low unfolded as a 5-wave impulse followed by a 3-swing correction (ABC) and discuss our forecast for the next move. Let’s dive into the structure and expectations for this stock. Five wave impulse structure + ABC + WXY correction $MSFT 8H Elliott Wave chart 9.04.2025 In the 8-hour Elliott Wave count from Sep 04, 2025, we saw that $MSFT completed a 5-wave impulsive cycle at red III. As expected, this initial wave prompted a pullback. We anticipated this pullback to unfold in 3 swings and find buyers in the equal legs area between $497.02 and $471.06 This setup aligns with a typical Elliott Wave correction pattern (ABC), in which the market pauses briefly before resuming its primary trend. $MSFT 8H Elliott Wave chart 7.14.2025 The update, 10 days later, shows the stock finding support from the equal legs area as predicted allowing traders to get risk free. The stock is expected to bounce towards 525 – 532 before deciding if the bounce is a connector or the next leg higher. A break into new ATHs will confirm the latter and can see it trade higher towards 570 – 593 area. Until then, traders should get risk free and protect their capital in case of a WXY double correction. Conclusion In conclusion, our Elliott Wave analysis of Microsoft Corp. ($MSFT) suggested that it remains supported against April 07, 2025 lows and bounce from the blue box area. In the meantime, keep an eye out for any corrective pullbacks that may offer entry opportunities. By applying Elliott Wave Theory, traders can better anticipate the structure of upcoming moves and enhance risk management in volatile markets. Source: https://www.fxstreet.com/news/microsoft-corp-msft-blue-box-area-offers-a-buying-opportunity-202509171323
Share
BitcoinEthereumNews2025/09/18 03:50
USD/JPY drops to near 157.80 as US-EU disputes batter US Dollar

USD/JPY drops to near 157.80 as US-EU disputes batter US Dollar

The post USD/JPY drops to near 157.80 as US-EU disputes batter US Dollar appeared on BitcoinEthereumNews.com. The USD/JPY pair is down 0.2% to near 157.80 during
Share
BitcoinEthereumNews2026/01/20 21:27