

Market Indicators Signal Another Crash For Pi Network Price
PI Network’s native token PI has remained locked in a sideways trend after slipping to a fresh all-time low of $0.1842 on September 22.
Since then, the cryptocurrency has oscillated within a horizontal channel, finding support at $0.2565 while facing resistance at $0.2917. With bearish clouds hanging over the broader market, PI risks revisiting its price low.
Weak Momentum Keeps PI Under Pressure
PI’s falling Average True Range (ATR) reflects the weakening momentum among spot market participants. Readings from the PI/USD one-day chart show that this indicator has steadily trended downward since the sideways trend began on September 23 to reach 0.0234 at press time.
Want more token insights like this? Sign up for Editor Harsh Notariya’s Daily Crypto Newsletter here.
 PI Average True Range. Source: TradingView
The ATR measures the degree of price movement over a given period. When it trends downward like this, it typically indicates that price fluctuations are narrowing and overall momentum is weakening.
This decline highlights the dwindling trader participation in the spot markets and the lack of new capital inflows into the token, hinting at the likelihood of a breakdown of the support at $0.2565 in the near term.
Moreover, PI trades solidly below its 20-day Exponential Moving Average (EMA), confirming this bearish outlook. At press time, this key moving average forms dynamic resistance above PI’s price at $0.3185.
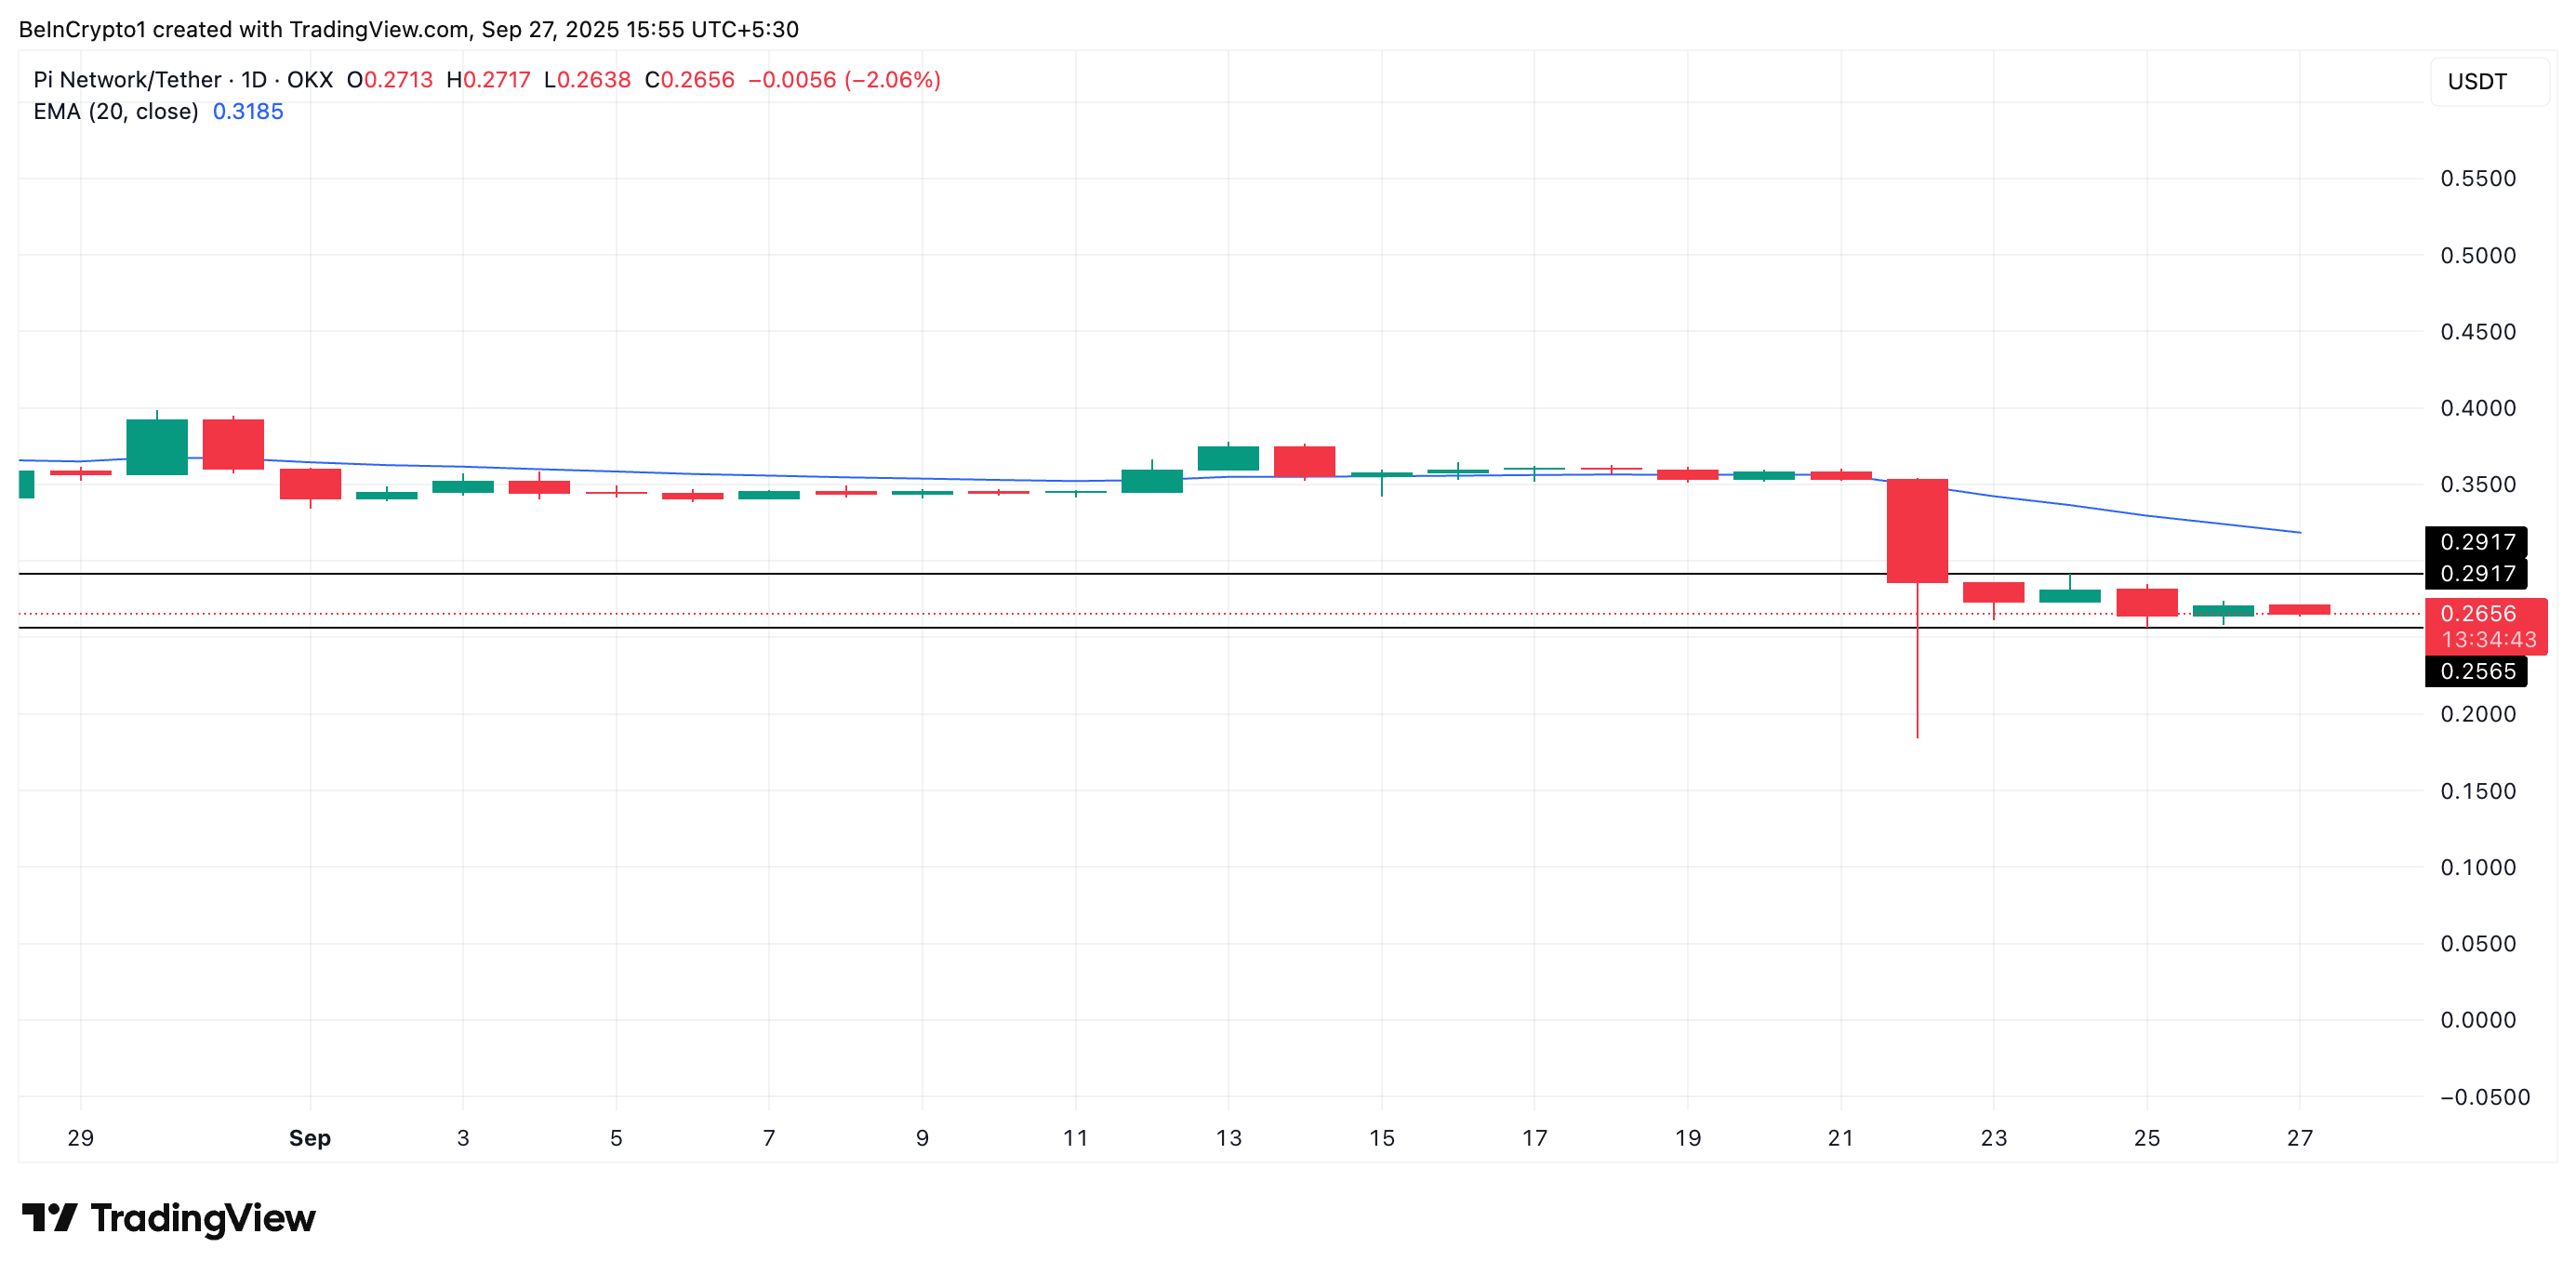 PI 20-Day EMA. Source: TradingView
The 20-day EMA measures an asset’s average price over the past 20 trading days, giving more weight to recent prices. When the price falls under it, sellers are in control, and market momentum is skewed to the downside.
This signals that PI is struggling to attract upward momentum and could extend its sideways movement, or even face fresh downside pressure if sentiment fails to improve.
Downside Risks Continue to Build
With trading momentum weakening, PI’s price action appears increasingly vulnerable to another breakdown. It could push below the $0.2565 support floor and revisit its all-time low.
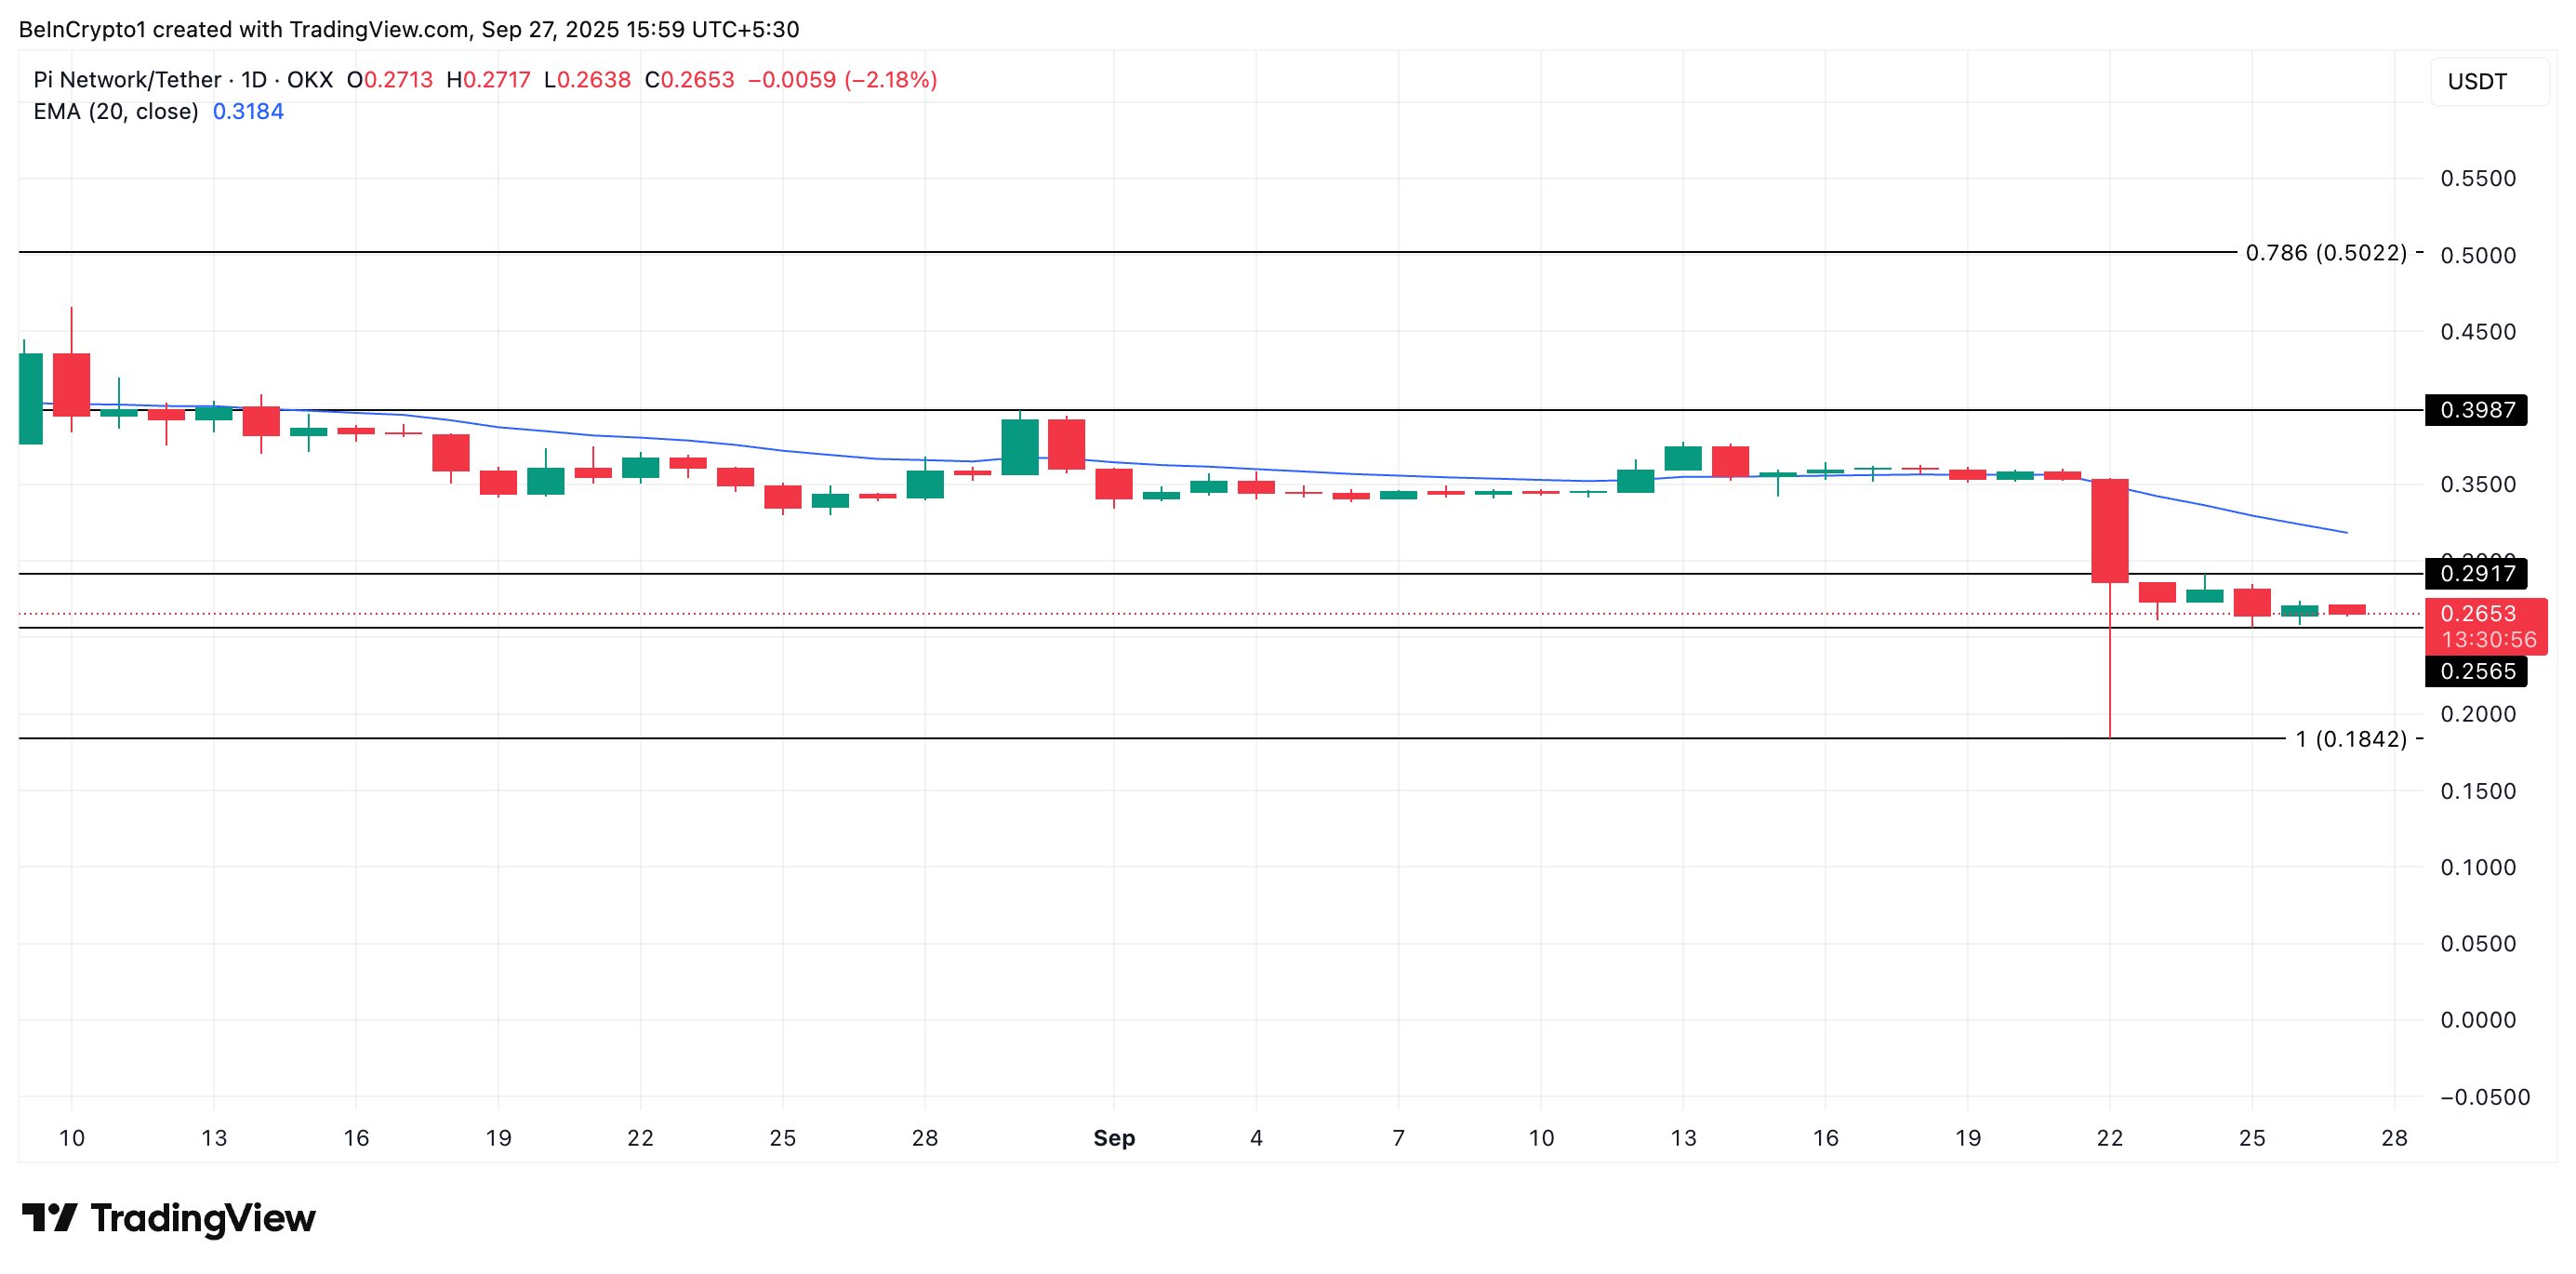 PI Price Analysis. Source: TradingView
Conversely, if sentiment improves, PI could attempt to breach the resistance at $0.2919. A breakout above this level could mark the start of a recovery attempt, pushing PI’s price above its 20-day EM


You May Also Like

Metaplanet Stock Passes MARA to Become Third-Largest BTC Holder — Stock Slips Anyway

Best Music AI Websites For Songs And Soundtracks

StakeStone (STO) Rockets 125%: What $981M Trading Volume Reveals


