SOL price is showing signs of weakness as the stablecoin supply on the network keeps declining. According to data from crypto.news, the 6th largest cryptocurrency by market cap has dropped 5% from its weekly and 21% from its highest point…SOL price is showing signs of weakness as the stablecoin supply on the network keeps declining. According to data from crypto.news, the 6th largest cryptocurrency by market cap has dropped 5% from its weekly and 21% from its highest point…

Solana (SOL) price flashes bearish crossover as stablecoin supply shrinks

SOL price is showing signs of weakness as the stablecoin supply on the network keeps declining.

Summary
  • Solana price is down 21% from its monthly high.
  • Stablecoin supply on the network has dropped over the past 7 days.
  • Technical indicators are largely bearish, and a bearish crossover has formed on the daily chart.

According to data from crypto.news, the 6th largest cryptocurrency by market cap has dropped 5% from its weekly and 21% from its highest point this month.

Solana (SOL) price drop comes as the total supply of stablecoins on the Solana network continued to shrink, dropping by 5.5% to $15.01 billion in the past 7 days. Since stablecoins often serve as the primary liquidity rail and capital base for on-chain trading, this decline signals waning investor demand and reduced capital inflows, adding to the bearish pressure on SOL.

This is happening as markets turned red, weighed down by renewed macro jitters stemming from escalating U.S.–China tariff tensions and the ongoing government shutdown. These developments have pushed investors away from risk assets for now, as many wait for clearer signals before re-entering the markets with conviction.

Traders are also in a wait-and-watch mode ahead of the U.S. CPI report due on Oct. 24, a key data point that could shape the Federal Reserve’s next move.

Originally delayed due to the government shutdown earlier this month, the report will also determine the 2026 Social Security cost-of-living adjustment and could sway market sentiment in a big way. If inflation comes in hotter than expected, it could put fresh pressure on crypto assets like Solana. On the flip side, a cooler CPI print might spark a broader relief rally across risk-on markets.

Solana price analysis

Amidst the broader market weakness and shrinking stablecoin supply, SOL price action also appears to present a bearish outlook on the 1-day chart. 

Notably, the 20-day simple moving average has formed a bearish crossover with the 50-day one as it crossed below it. In technical analysis, this points to weakening momentum and a possible trend continuation to the downside.

SOL price has formed a bearish crossover on the daily chart.

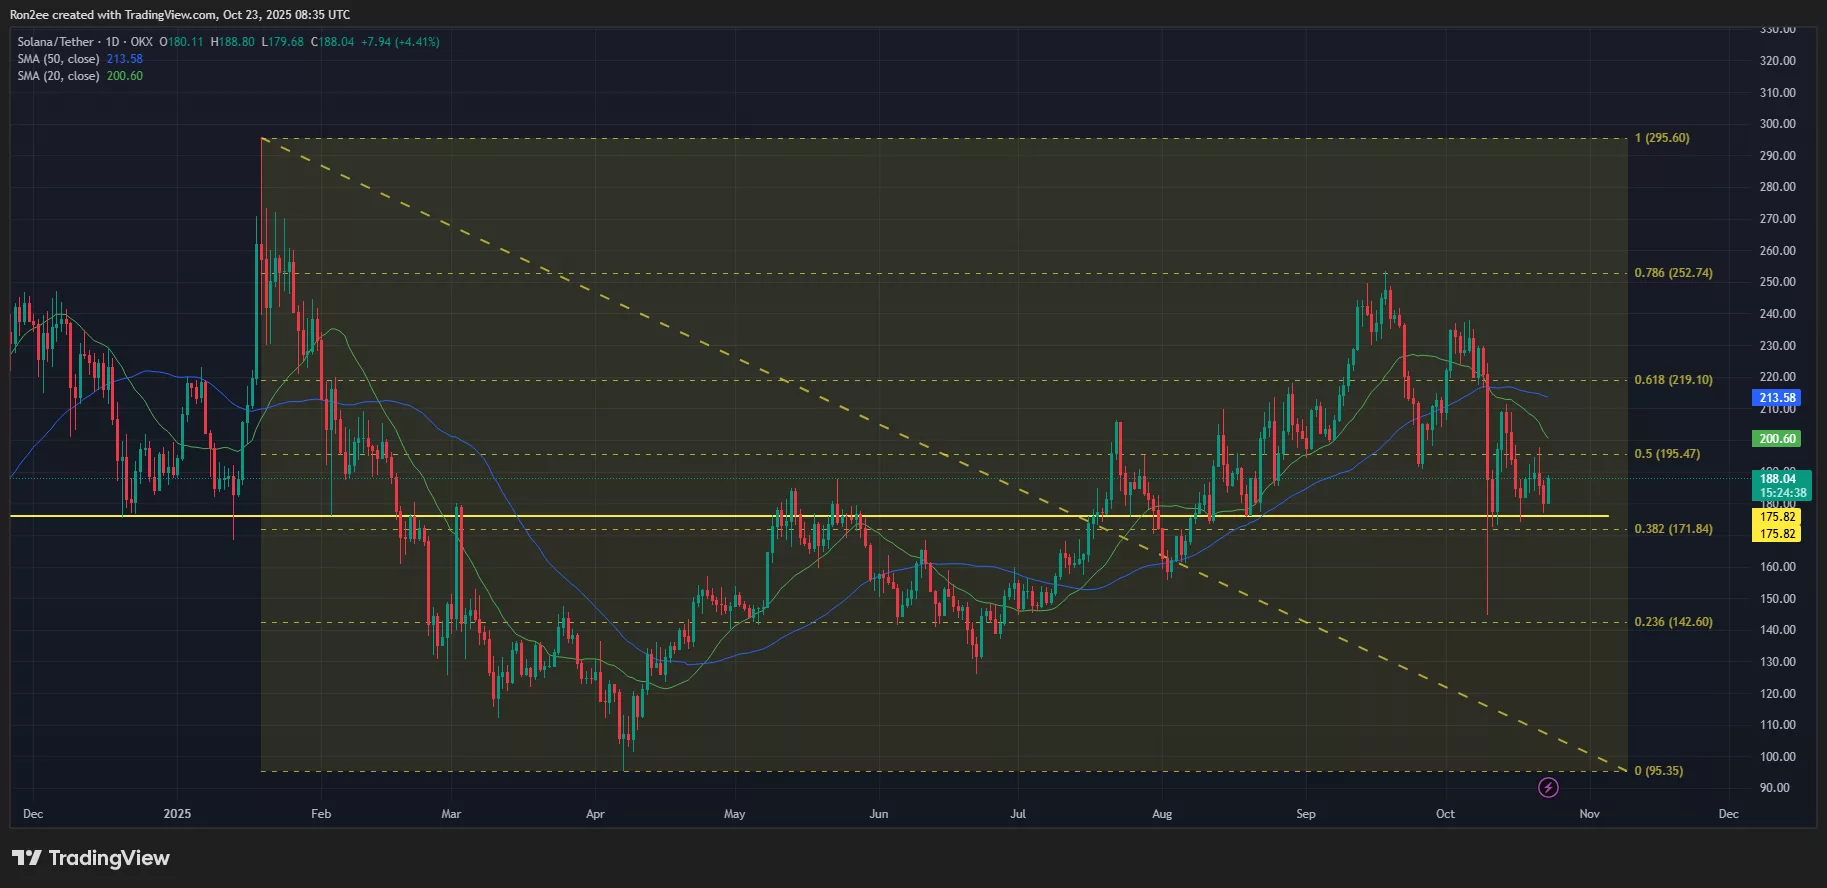
As analysts at crypto.news reported earlier, Solana was trading below the 200-day EMA, a key dynamic level closely watched by both traders and investors. This level also aligns with a psychological resistance zone near the $200 mark.

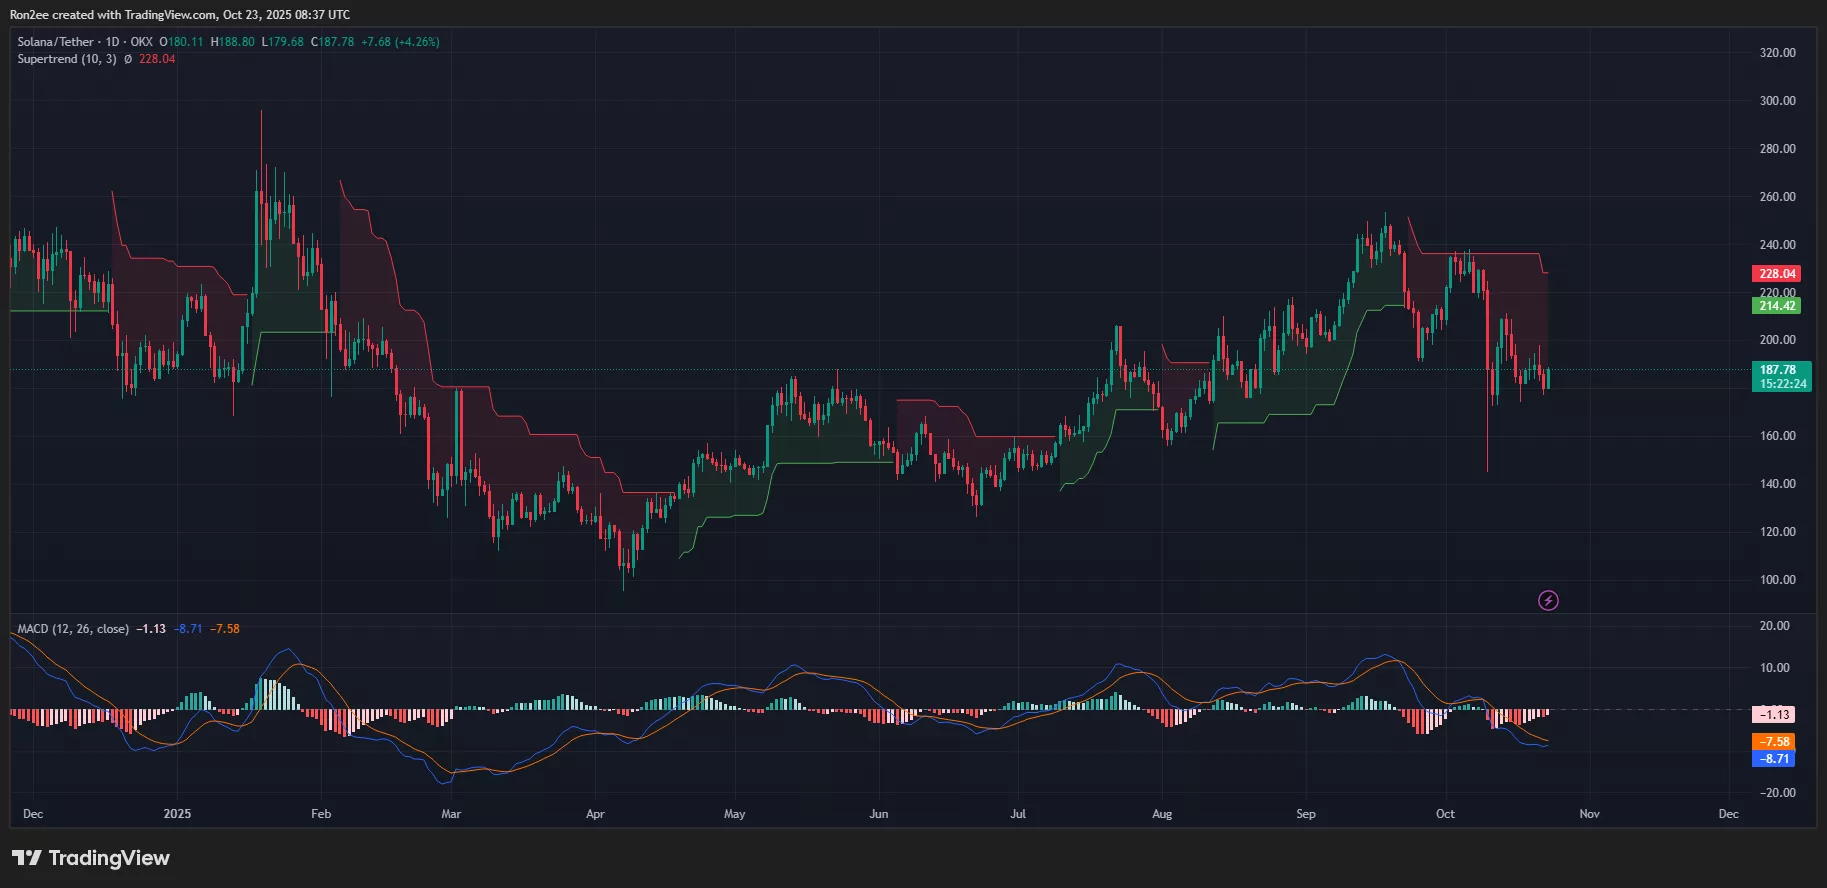
For now, other technical indicators also seem to support the bearish bias. Notably, the Supertrend has flashed red, while the MACD lines have pointed downward, both signs of continued selling pressure.

Solana Supertrend and MACD chart.

At press time, Solana price was approaching a very crucial support level at $175.82. Bulls have previously stepped in to defend this area on multiple occasions. 

A breakdown below it could pave the way for a significant correction, potentially sending SOL toward lower demand zones around $165 or even $150 if bearish momentum accelerates.

On the contrary, if Solana bulls manage to stage a rebound to $200, it could trigger a trend reversal, opening the door for a potential recovery in the near term.

Disclosure: This article does not represent investment advice. The content and materials featured on this page are for educational purposes only.

Market Opportunity
Solana Logo
Solana Price(SOL)
$126.73
$126.73$126.73
-0.08%
USD
Solana (SOL) Live Price Chart
Disclaimer: The articles reposted on this site are sourced from public platforms and are provided for informational purposes only. They do not necessarily reflect the views of MEXC. All rights remain with the original authors. If you believe any content infringes on third-party rights, please contact service@support.mexc.com for removal. MEXC makes no guarantees regarding the accuracy, completeness, or timeliness of the content and is not responsible for any actions taken based on the information provided. The content does not constitute financial, legal, or other professional advice, nor should it be considered a recommendation or endorsement by MEXC.

You May Also Like

GALA Technical Analysis Jan 25

GALA Technical Analysis Jan 25

The post GALA Technical Analysis Jan 25 appeared on BitcoinEthereumNews.com. Today’s short-term outlook: GALA is trapped in a sideways range, with downside pressure
Share
BitcoinEthereumNews2026/01/25 11:42
Polygon Tops RWA Rankings With $1.1B in Tokenized Assets

Polygon Tops RWA Rankings With $1.1B in Tokenized Assets

The post Polygon Tops RWA Rankings With $1.1B in Tokenized Assets appeared on BitcoinEthereumNews.com. Key Notes A new report from Dune and RWA.xyz highlights Polygon’s role in the growing RWA sector. Polygon PoS currently holds $1.13 billion in RWA Total Value Locked (TVL) across 269 assets. The network holds a 62% market share of tokenized global bonds, driven by European money market funds. The Polygon POL $0.25 24h volatility: 1.4% Market cap: $2.64 B Vol. 24h: $106.17 M network is securing a significant position in the rapidly growing tokenization space, now holding over $1.13 billion in total value locked (TVL) from Real World Assets (RWAs). This development comes as the network continues to evolve, recently deploying its major “Rio” upgrade on the Amoy testnet to enhance future scaling capabilities. This information comes from a new joint report on the state of the RWA market published on Sept. 17 by blockchain analytics firm Dune and data platform RWA.xyz. The focus on RWAs is intensifying across the industry, coinciding with events like the ongoing Real-World Asset Summit in New York. Sandeep Nailwal, CEO of the Polygon Foundation, highlighted the findings via a post on X, noting that the TVL is spread across 269 assets and 2,900 holders on the Polygon PoS chain. The Dune and https://t.co/W6WSFlHoQF report on RWA is out and it shows that RWA is happening on Polygon. Here are a few highlights: – Leading in Global Bonds: Polygon holds 62% share of tokenized global bonds (driven by Spiko’s euro MMF and Cashlink euro issues) – Spiko U.S.… — Sandeep | CEO, Polygon Foundation (※,※) (@sandeepnailwal) September 17, 2025 Key Trends From the 2025 RWA Report The joint publication, titled “RWA REPORT 2025,” offers a comprehensive look into the tokenized asset landscape, which it states has grown 224% since the start of 2024. The report identifies several key trends driving this expansion. According to…
Share
BitcoinEthereumNews2025/09/18 00:40
Trump administration is investing $1.6 billion into USA Rare Earth

Trump administration is investing $1.6 billion into USA Rare Earth

The Trump administration is throwing $1.6 billion into USA Rare Earth, the largest move it’s made yet in the rare earths sector. The company, listed publicly and
Share
Cryptopolitan2026/01/25 11:14