

SUI crypto news: can SUIUSDT rebound from extreme fear?
 SUI crypto news is unfolding against a backdrop of deep caution, where the token trades under heavy technical pressure but also shows the first hints of short-term stabilization. In this piece we connect the broader market mood with the daily and intraday indicators to understand whether the current slide is nearer to exhaustion or only mid-way through a larger downtrend.
 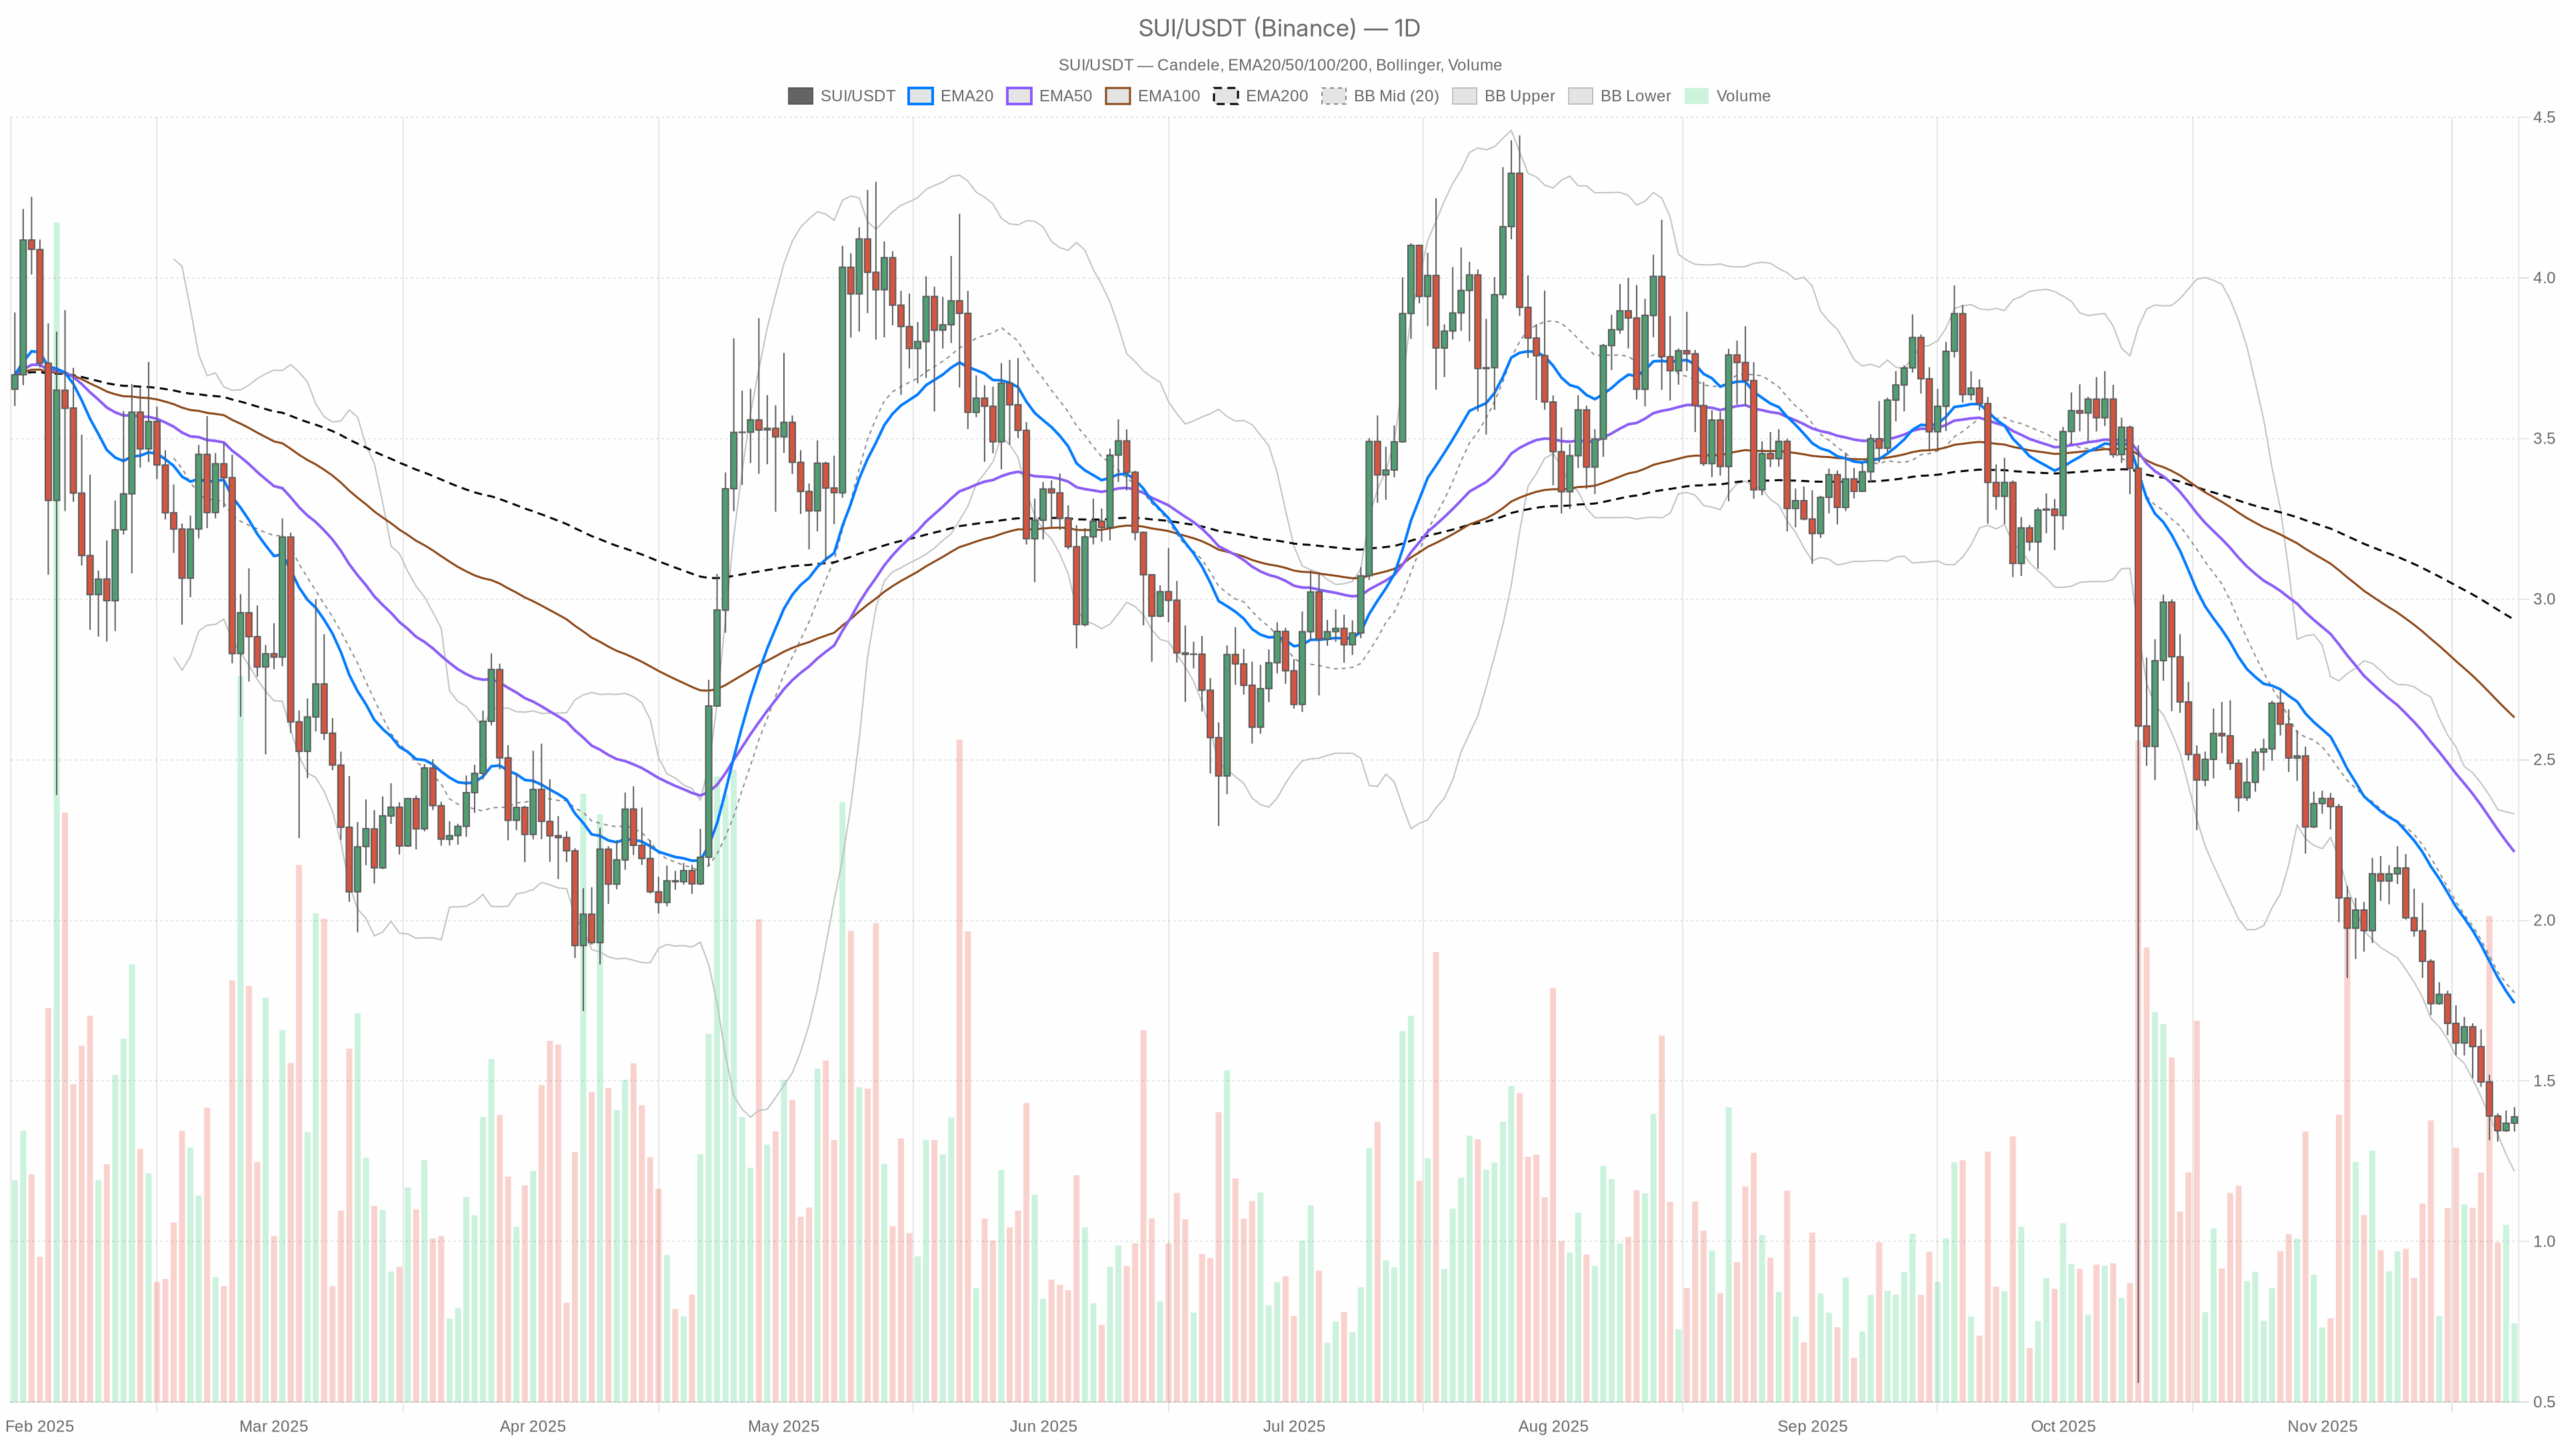 SUI/USDT — daily chart with candlesticks, EMA20/EMA50 and volume.
Summary
The asset is changing hands around 1.39 USDT, clearly below its major daily moving averages, which confirms a dominant bearish trend on the higher timeframe. Momentum on the daily chart is weak, with an oversold RSI and a negative MACD backdrop that points to sellers still in control. However, volatility measured by ATR remains moderate, suggesting controlled rather than chaotic selling. At the same time, the hourly and 15-minute charts look more balanced, hinting at short-term consolidation instead of further immediate collapse. Market-wide, bitcoin‘s dominance near 57% and a Fear & Greed Index stuck in Extreme Fear reveal risk-off behavior that weighs on altcoins. Overall, this is a market where patience and selective entries matter more than chasing quick upside.
SUI crypto news: Market Context and Direction
The global crypto market capitalization stands around 3.04 trillion dollars, edging up by roughly 0.6% over the last 24 hours. Despite that mild advance, bitcoin holds about 56.9% market dominance, which signals a risk-averse market regime where capital prefers the relative safety of the benchmark rather than smaller tokens. Moreover, the Fear & Greed Index sits at 19, firmly in Extreme Fear, illustrating how reluctant traders remain to add exposure across the board.
In this climate, the asset’s weakness versus its historical levels is unsurprising. While the broader market cap creeps higher, the token is stuck in a daily bearish setup, which indicates underperformance relative to the aggregate market. That said, decentralized exchanges in the Sui ecosystem such as Cetus CLMM and Bluefin Spot continue to generate sizeable cumulative fees, a sign that underlying network activity has not vanished even as prices struggle. As a result, the fundamental usage backdrop may help limit structural damage once sentiment eventually normalizes.
Technical Outlook: reading the overall setup
On the daily timeframe, price at 1.39 is well below the 20-day exponential moving average at 1.74, the 50-day at 2.21, and the 200-day near 2.94. This wide gap between spot and the major EMAs illustrates persistent downside pressure and a mature downtrend rather than a shallow pullback. Each of those moving averages now likely acts as dynamic overhead resistance, implying that any bounce will meet supply on the way up.
The daily RSI around 25.2 places the token firmly in oversold territory. Historically, readings this low often precede at least a corrective rebound, as aggressive sellers begin to run out of fuel. However, RSI can stay oversold in strong bear phases, so this setup indicates downtrend exhaustion risks but not yet a confirmed reversal. Traders often look for bullish divergences or a recovery back above the 30–35 zone to strengthen the case for a bottom.
Daily MACD also leans negative, with the line near -0.27 and the signal at -0.26, while the histogram is only slightly below zero. This configuration shows that downside momentum has already been strong, yet it might be starting to flatten. A narrowing histogram reflects waning bearish momentum, suggesting that the pace of decline is slowing even if the direction has not yet turned.
Bollinger Bands on the daily chart place the middle band at 1.77, with the upper band at 2.33 and the lower band close to 1.22. Price currently hovers just above the lower band, signaling that recent candles have pressed into statistically stretched territory. Such positioning often precedes either a sideways consolidation or a volatility snapback, meaning a potential volatility expansion could emerge if price begins to mean-revert toward the middle band.
The 14-day ATR sits near 0.15, relatively modest given the absolute price level. This indicates that, despite the downtrend, daily swings are not extreme and the market is experiencing controlled volatility rather than panic-driven capitulation. For position traders, this environment favors scaled entries and exits instead of all-or-nothing bets.
Intraday Perspective and SUIUSDT token Momentum
Meanwhile, the intraday structure paints a more neutral picture. On the hourly chart, price around 1.39 trades almost exactly in line with the 20- and 50-period EMAs near 1.38, while the 200-period EMA lags above at roughly 1.53. This configuration signals that short-term price action has shifted into consolidation after a downtrend, with bulls and bears temporarily balanced below a still-dominant longer-term resistance line.
The hourly RSI near 53 points to a neutral momentum regime: neither overbought nor oversold, and consistent with a market catching its breath. The hourly MACD line and signal are roughly flat around zero, reinforcing the idea that immediate directional conviction is limited. On the 15-minute chart, EMAs cluster tightly around 1.38–1.39 and RSI sits around 49, again underlining a short-term equilibrium. As a result, scalpers may find range-trading setups more attractive than trend-following strategies until a clearer breakout unfolds.
Key Levels and Market Reactions
Daily pivot levels add useful context. The main pivot point is close to 1.38, effectively where price is currently gravitating. Holding above this area keeps the door open for a technical bounce, while a decisive close below would confirm continuing weakness. Just below lies a first support zone around 1.35, where buyers may attempt to defend against further declines; a firm reaction there would support a short-term basing attempt.
On the upside, the nearest resistance band appears near 1.42, the first daily pivot resistance. A move through that region with rising volume could mark the first step in a broader corrective phase toward the 20-day EMA near 1.74. However, the cluster of higher EMAs up to the 200-day line near 2.94 means that any medium-term recovery will face layered resistance overhead, and swift V-shaped reversals are statistically less likely.
Future Scenarios and Investment Outlook
Overall, the primary scenario remains bearish on the daily chart, with the asset entrenched below all key EMAs and sentiment weighed down by Extreme Fear and high bitcoin dominance. Yet several signals, from oversold daily RSI to flattening MACD and neutral intraday momentum, point toward a phase where downside momentum may be losing strength. This combination often leads first to sideways consolidation, then to a corrective rally if macro conditions cooperate.
Investors and traders may therefore consider a two-step approach: short-term participants focusing on intraday ranges around the 1.35–1.42 corridor, and longer-term participants waiting for stronger confirmation such as RSI reclaiming the 30–40 zone or price regaining the 20-day EMA. In such a fragile backdrop, strict risk management, staggered orders, and realistic expectations about recovery speed are crucial while the market works through its current extremes.
This analysis is for informational purposes only and does not constitute financial advice.
Readers should conduct their own research before making investment decisions.
You May Also Like

Gold Hits $3,700 as Sprott’s Wong Says Dollar’s Store-of-Value Crown May Slip

