

Bitcoin Price Prediction as Trump Pushes 10% Credit Card Interest Rate Cap
Bitcoin price has traded tightly between $90,200 and $90,700 over the last 24 hours, currently at $90,659 as of 12:34 a.m. EST. BTC has been holding steady above $90,000, with indecisive trading between $89,000 and $94,000.
As President Donald Trump continues jarring markets with announcements aimed at making homes more affordable, the president has swiveled yet another consumer burden by demanding that credit-card lenders cap interest rates at 10% for a year starting January 20.
Trump had earlier made this pledge during the 2024 campaign, which he won.
The cap would primarily affect banks that issue cards, such as JPMorgan Chase, Citigroup, and Capital One Financial, by limiting their interest revenue. This may lead to a challenge in court, as it harms credit access and violates market principles.
On the other hand, BTC’s price previously peaked at $126,000 in early October but later faced downward pressure amid global financial uncertainty. Can the Bitcoin price still recover to overcome the $94,000 barrier?
Bitcoin Price Analysis: Technicals Support A Rally In The Short Term
According to the BTC/USD chart analysis on the 4-hour chart, the BTC price is currently facing prolonged resistance at the $94,000 level, with historical trend movements suggesting an incoming rally.
Technicals are also supporting a surge, with Bitcoin trading well above the 200-day Simple Moving Average (SMA) ($89,311) and the moving averages forming a golden cross around $89,271. The 50-day SMA at $91,456 serves as the next overhead resistance, putting BTC under short-term pressure.
Meanwhile, the Bitcoin Relative Strength Index shows a moment of indecision, trading around the neutral 46 level, as the price continues to trade within the $90,000 range from January 7.
However, the Moving Average Convergence Divergence (MACD) has turned positive, with the blue MACD line crossing above the orange signal line.
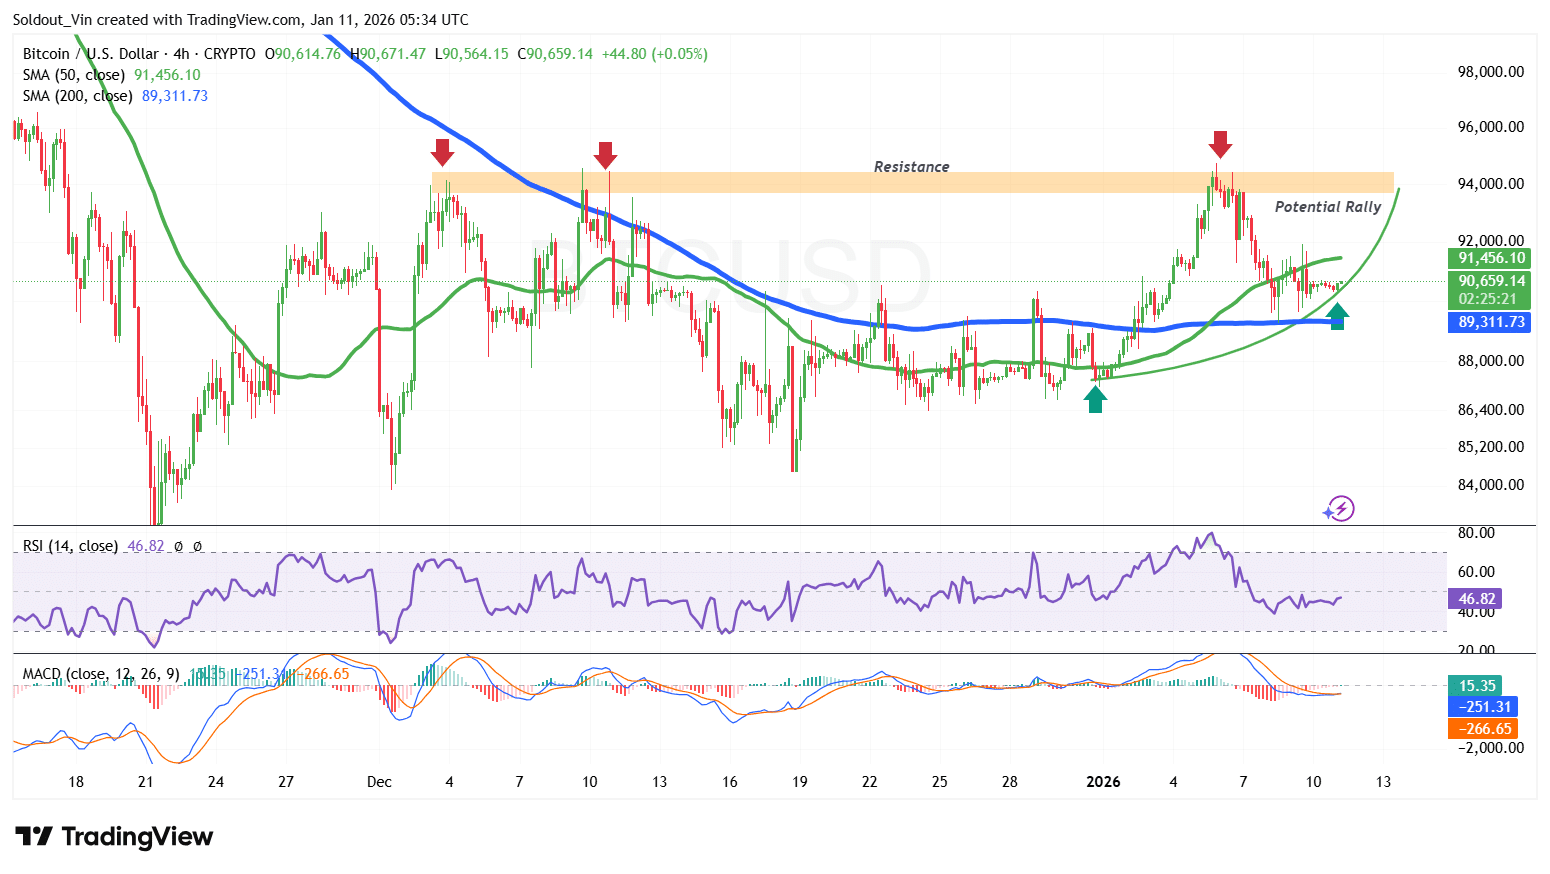 BTC/USD Chart Analysis Source: TradingView
As the technicals turn positive, Bitcoin could surge above the 50-day SMA, with the price heading toward the $94,000 resistance area.
On the downside, a drop below $89,000 could trigger a downtrend, potentially pushing Bitcoin to the $87,200 support.
Related News:


You May Also Like

'I'm sorry, what?' White House faith advisor stuns with gaffe about Trump at Sunday school

The $1.3 Trillion Race: Bitcoin’s Critical Quantum Security Crossroads


