

Bitcoin price loses dynamic MA support amid ongoing leverage reset
Bitcoin price has slipped below key short-term trend support as traders continued to unwind leverage across derivatives markets.
- Bitcoin slipped below short-term trend support as leverage unwound.
- Derivatives data points to forced positioning resets, not panic selling.
- The chart shows heavy resistance above and fragile downside support.
Bitcoin slipped to $88,218 at press time, down 1.2% over the past 24 hours, as the price fell back below key short-term trend support during an ongoing leverage unwind.
Over the last seven days, the token has fluctuated between $86,319 and $90,475. It is currently down about 2% for the week and roughly 30% below its all-time high of $126,080, which was set in October 2025.
During the decline, spot activity increased, with 24-hour trading volume increasing 12.3% to $49.1 billion. Derivatives positioning points to a market still flushing excess risk.
Open interest contractions have accompanied recent swings, a pattern consistent with forced deleveraging rather than steady spot selling.
The behavior fits a reset phase where traders reduce exposure and wait for clearer direction.
CryptoQuant flags macro fatigue during leverage unwind
In a Jan. 29 analysis, CryptoQuant contributor CryptoZeno noted that Bitcoin’s (BTC) recent quarterly performance marks a shift away from the strong expansion seen through mid-2025 and into a corrective or consolidation phase.
The analysis shows that rather than full-scale capitulation, recent drawdowns are pushing into deeper historical correction zones that are usually associated with cyclical resets.
Price trading below the one-year average drawdown indicates a slower, more deliberate cooling phase where risk appetite decreases and capital deployment becomes more selective.
Derivatives data support that view. Repeated sharp drops in futures open interest line up with local price lows, pointing to leverage being forced out of the system.
CryptoZeno added that the 90-day market-versus-realized price gradient shows fading macro momentum, a setup often seen late in a cycle when price chops sideways while the market rebuilds a healthier cost basis.
External pressure has added to the caution. Spot Bitcoin exchange-traded fund outflows through late 2025 and early 2026, alongside tighter financial conditions and broader risk-off positioning, have limited demand during rebounds.
Bitcoin price technical analysis
From a chart perspective, Bitcoin is holding in the $88,000–$90,000 area but is firmly below its short-term trend structure. The loss of the 20-day moving average near $93,000–$94,000 marked a clear shift in near-term control, as that level had acted as support during the prior expansion.
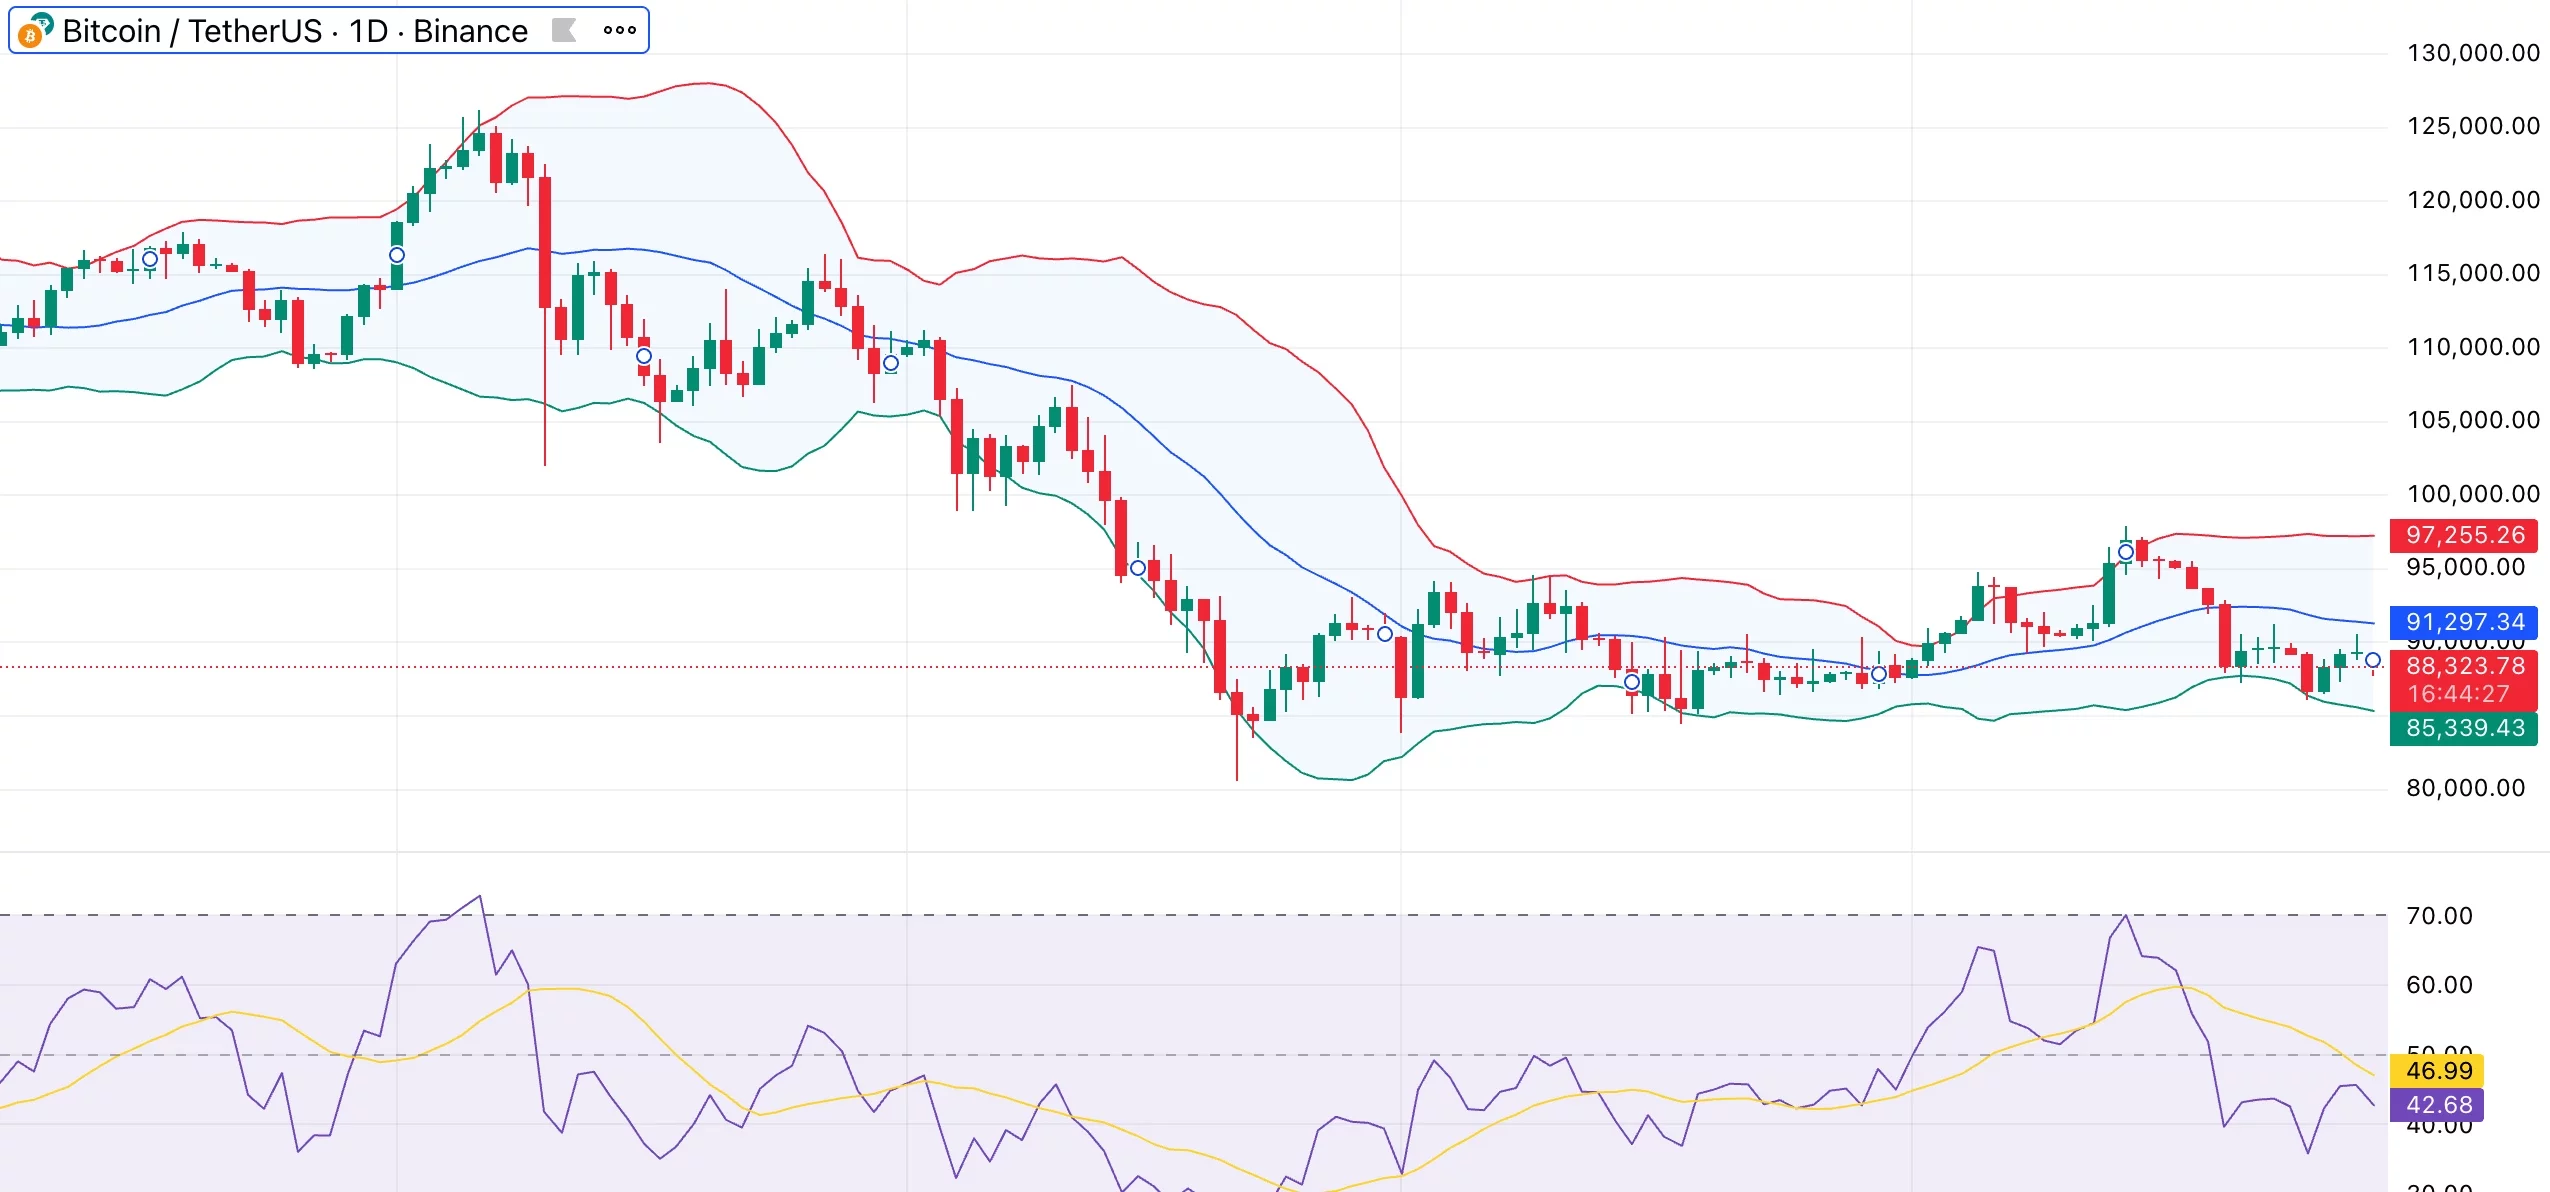
Overhead resistance is now layered. The 50-day average between $96,000 and $98,000 has turned into a ceiling, and repeated failures below that zone keep rallies capped. Until price can reclaim that area, upside moves look corrective rather than directional.
On the downside, attention turns to the 100-day average around $84,000–$86,000. Holding that zone would keep the pullback framed as a mid-cycle reset.
A break below it would expose deeper downside toward the low $80,000s, with the 200-day average near $74,000–$76,000 still well below and anchoring the long-term structure.
While oscillators cluster close to neutral, the relative strength index is in the low 40s, indicating weak but not stretched conditions. Compared to earlier in the month, selling pressure has decreased, but buyers have not yet intervened with conviction.
For now, Bitcoin is stuck between fading upside attempts and a market still clearing leverage. A daily close back above $94,000 would be the first sign that short-term control is shifting. Failure to defend the mid-$80,000 area would keep downside risk in play as the reset runs its course.


You May Also Like

Trump gives Iran 10 days to negotiate or face Strait of Hormuz reopening

‘Working on It’: Coinbase CEO Eyes Crypto in Hands of Billion People


