

Ethereum (ETH) Price: Head and Shoulders Pattern Forming — What Happens if $2,040 Breaks?
TLDR
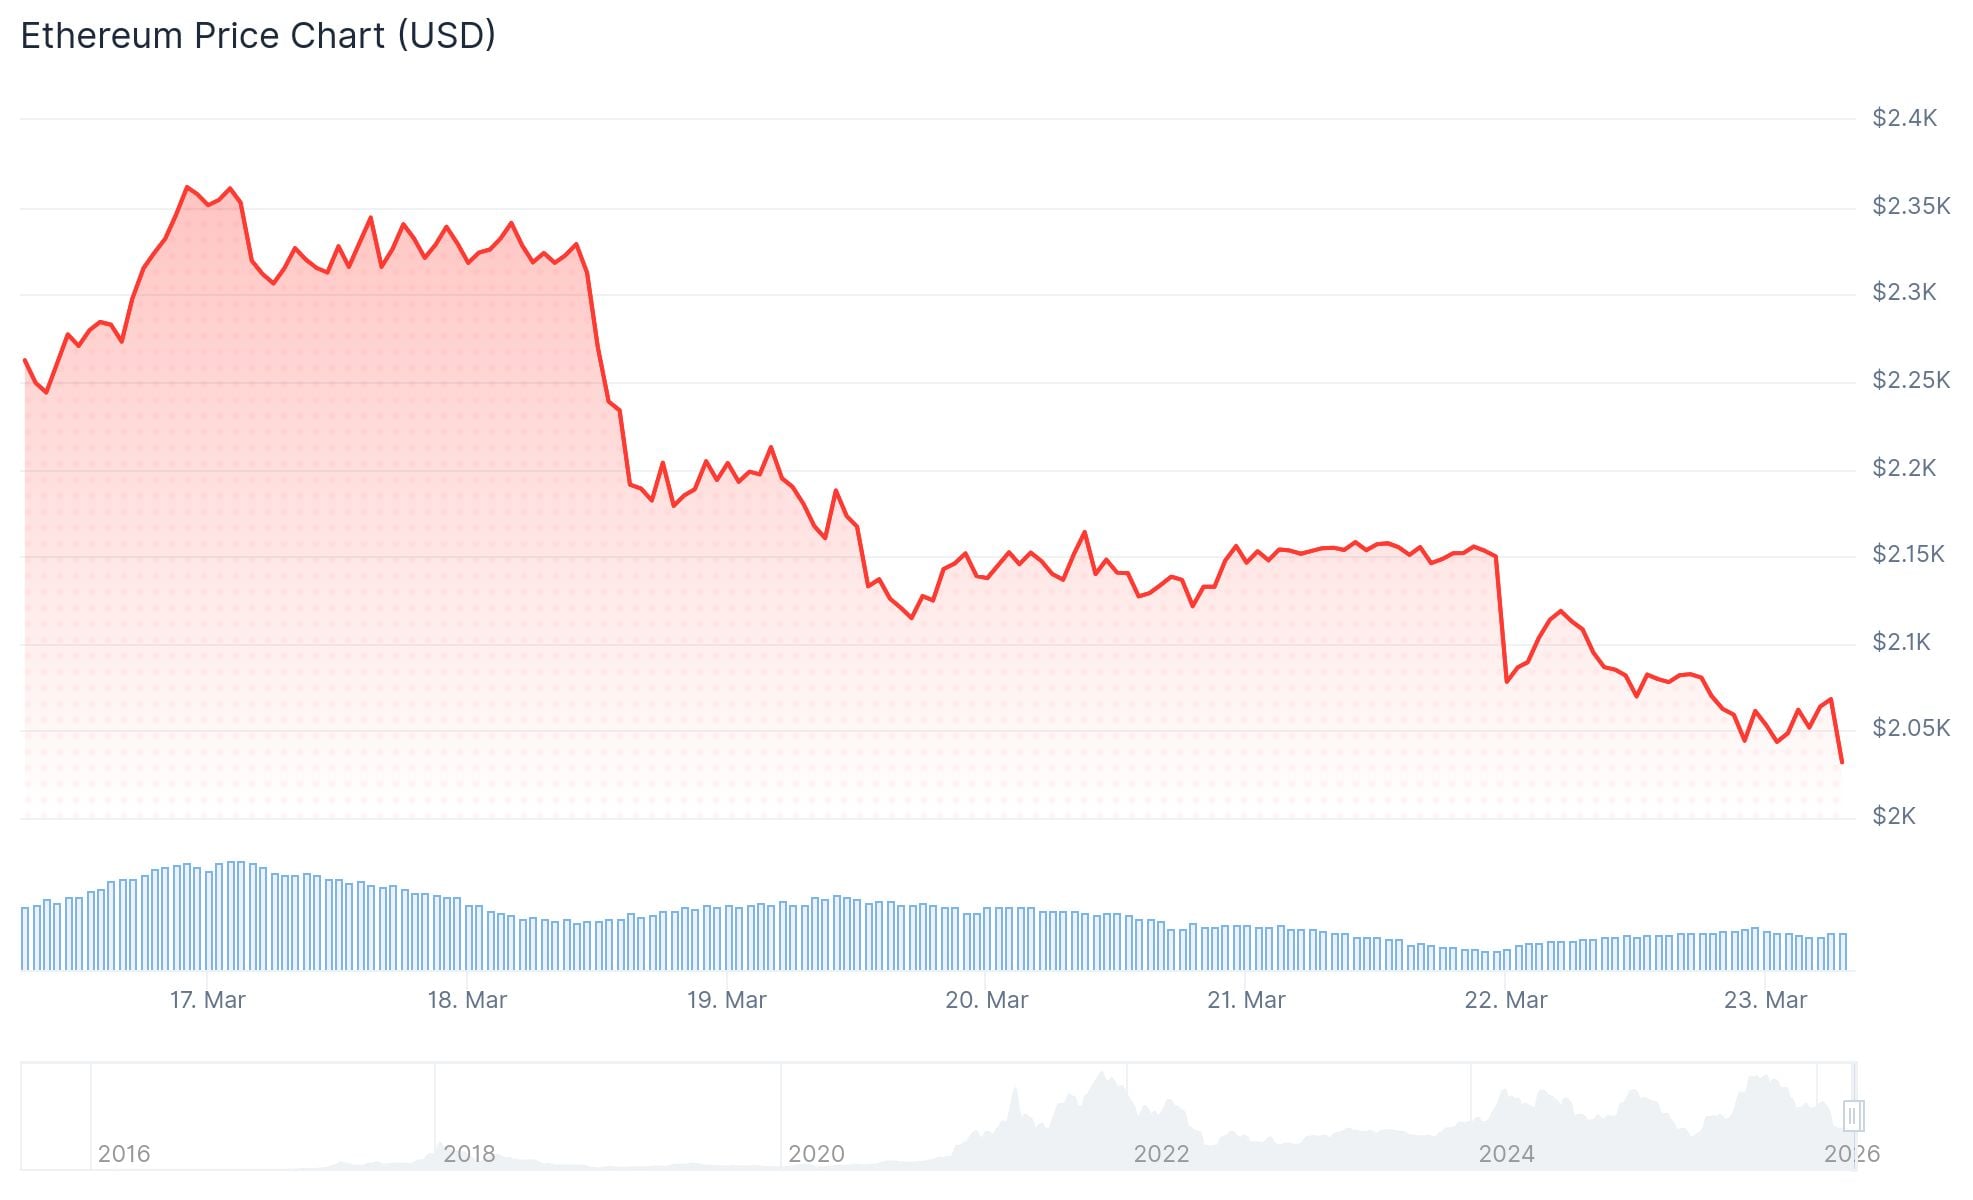
- ETH fell below $2,220 and hit a low of $2,025, now consolidating around $2,020–$2,100
- Two bearish trend lines are forming with resistance at $2,120 and $2,165
- A break above $2,165 could push ETH toward $2,200–$2,300; a drop below $2,025 risks a fall to $2,000 or lower
- Ethereum spot ETFs saw net outflows of $59.94 million last week, led by BlackRock’s ETHA at $69.59 million
- Total Ethereum spot ETF net assets stand at $12.33 billion, with a 4.79% ETF net asset ratio
Ethereum dropped sharply over the past day, falling from around $2,385 to a low of $2,025. The price is now trading below $2,100 and the 100-hourly Simple Moving Average.
 Ethereum (ETH) Price
The decline began after ETH failed to hold above $2,220. It broke through $2,150 and $2,120 before briefly spiking below $2,050.
ETH is currently consolidating losses below the 23.6% Fibonacci retracement level of the move from $2,385 to $2,025. Two bearish trend lines are visible on the hourly chart, with resistance sitting at $2,120 and $2,165.
The first key resistance level is at $2,120, which also aligns with the 100-hourly Simple Moving Average. A move above that would put $2,165 in play as the next hurdle.
If ETH clears $2,165, the 50% Fibonacci retracement level sits near $2,200. A break above that zone could open the way toward $2,250 or $2,300.
Key Support Levels to Watch
On the downside, initial support sits near $2,040. Below that, the $2,025 zone is the first major floor.
A clear break below $2,025 would put the $2,000 level in focus. Further losses could bring $1,965 into view, with $1,880 acting as deeper support.
Crypto analyst Ted Pillows posted on X that ETH appears to be forming a head and shoulders pattern. He wrote: “$ETH seems to be forming head and shoulder pattern. If Ethereum loses the $2,040 level, expect a massive dump.”
ETF Outflows Add Pressure
Ethereum spot ETFs recorded net outflows of $59.94 million for the week of March 16–20, according to SoSoValue data reported by PANews on March 23.
BlackRock’s ETHA led outflows with $69.59 million leaving the fund last week. ETHA’s historical total net inflow still stands at $11.91 billion.
Fidelity’s FETH saw $61.62 million in outflows over the same period. Its historical total net inflow sits at $2.32 billion.
The only ETF to record net inflows last week was the Grayscale Ethereum Mini Trust (ETH), which brought in $6.87 million. Its historical total net inflow has reached $1.85 billion.
As of March 23, total Ethereum spot ETF net assets stand at $12.33 billion, representing 4.79% of Ethereum’s total market cap. The historical cumulative net inflow across all Ethereum ETFs is $11.73 billion.
The post Ethereum (ETH) Price: Head and Shoulders Pattern Forming — What Happens if $2,040 Breaks? appeared first on CoinCentral.


You May Also Like

DOT Price Prediction: Polkadot Eyes $1.50 Recovery as Technical Indicators Signal Oversold Conditions

Here’s How High Kaspa (KAS) Price Could Go This New Week


