2026-05-15 Friday
Ethereum News in India
Follow top ETH trends and Ethereum ecosystem updates in India

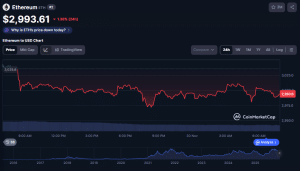
ETH fell below $3,000, down 1.03% on the day.
PANews reported on December 1st that, according to OKX market data, ETH has just fallen below $3,000 and is currently trading at $2,997.56 per coin, down 1.03% on the day.
Share
Author: PANews2025/12/01 07:37

Based on 10 valuation methods, how much is ETH really worth?
Written by Eric, Foresight News What should be the reasonable price of ETH? The market has offered numerous valuation models for this issue. Unlike Bitcoin, which has already established itself as a major asset, Ethereum, as a smart contract platform, should have a reasonable and widely accepted valuation system. However, it seems that the Web3 industry has yet to reach a consensus on this matter. A recent website launched by Hashed presented 10 valuation models that are likely to be widely accepted by the market. Of these 10 models, 8 showed that Ethereum is undervalued, with a weighted average price exceeding $4,700. So how was this price, which is close to a historical high, calculated? From TVL to staking to income Hashed categorized the 10 models into three levels—low, medium, and high—based on their reliability. We'll start with the low-reliability valuation models. TVL multiplier This model posits that Ethereum's valuation should be a multiple of its DeFi TVL, simply linking market capitalization to TVL. Hashed used the average market capitalization to TVL ratio from 2020 to 2023 (my personal understanding is from the beginning of DeFi Summer until the nested structure was not yet severe) of 7 times. By multiplying the current DeFi TVL on Ethereum by 7 and then dividing by the supply, i.e., TVL × 7 ÷ Supply, the resulting price is $4128.9, representing a 36.5% upside from the current price. This crude calculation method, which only considers DeFi TVL and cannot accurately derive the actual TVL due to its complex nested structure, certainly deserves its low reliability. Scarcity premium resulting from pledging The model takes into account that Ethereum that cannot circulate in the market due to staking will increase Ethereum's "scarcity". Multiplying the current price of Ethereum by the square root of the ratio of total supply to circulating supply, i.e., Price × √(Supply ÷ Liquid), the resulting price is 3528.2, which is 16.6% upside from the current price. This model was developed by Hashed itself, and the square root calculation is intended to mitigate extreme cases. However, according to this algorithm, ETH is always undervalued, not to mention the rationality of simply considering the "scarcity" brought about by staking and the additional liquidity of staked Ethereum released by LST, which is also very crude. Mainnet + L2 TVL multiplier Similar to the first valuation model, this model adds the TVL of all L2 and gives it a 2x weighting because of the L2's consumption of Ethereum. The calculation method is (TVL + L2_TVL×2) × 6 ÷ Supply, which gives a price of 4732.5, representing a 56.6% upside from the current price. As for the number 6, although it's not specified, it's likely a multiplier derived from historical data. While L2 is included, this valuation method still simply references TVL data and isn't significantly better than the first method. "Commitment" Premium This approach is similar to the second model, except it adds Ethereum locked in DeFi protocols. The multiplier in this model is calculated by dividing the total amount of ETH staked and locked in DeFi protocols by the total ETH supply. This multiplier represents a percentage premium resulting from a "long-term holding belief and lower liquidity supply." Adding this percentage to 1 and multiplying it by the "committed" asset's value premium index of 1.5 relative to liquid assets yields a reasonable ETH price under this model. The formula is: Price × [1 + (Staked + DeFi) ÷ Supply] × Multiplier, resulting in a price of $5097.8, representing a 69.1% upside from the current price. Hashed stated that the model was inspired by the concept that L1 tokens should be considered as currency rather than stocks, but it still falls into the problem of the fair price always being higher than the current price. The biggest problem with the four unreliable valuation methods mentioned above is the lack of rationality in considering a single dimension. For example, a higher TVL (Total Value Limit) is not necessarily better; providing better liquidity with a lower TVL is actually an improvement. As for treating Ethereum, which does not participate in circulation, as a form of scarcity or loyalty that generates a premium, this seems unable to explain how to value it once the price actually reaches the expected price. Having discussed four low-reliability valuation schemes, let's now look at five medium-reliability schemes. Market capitalization/TVL fair value This model is essentially a mean reversion model. The calculation method assumes that the historical average value of the market capitalization to TVL ratio is 6 times. If it exceeds 6 times, it is considered overvalued, and if it is not 6 times, it is considered undervalued. The formula is Price × (6 ÷ Current Ratio), which gives a price of $3,541.1, representing a 17.3% upside potential from the current price. This calculation method, which superficially references TVL data, actually takes into account historical patterns and uses a more conservative valuation approach, which does seem more reasonable than simply referencing TVL. Metcalfe's Law Metcalfe's Law is a law concerning the value of networks and the development of network technology. Proposed by George Gilder in 1993, it is named after Robert Metcalfe, a pioneer in computer networking and founder of 3Com, in recognition of his contributions to Ethernet. It states that the value of a network is equal to the square of the number of nodes within it, and that the value of the network is directly proportional to the square of the number of connected users. Hashed stated that the model has been empirically validated by academic researchers (Alabi 2017, Peterson 2018) on Bitcoin and Ethereum. TVL is used as a proxy metric for network activity. The calculation formula is 2 × (TVL/1B)^1.5 × 1B ÷ Supply, yielding a price of $9957.6, representing a 231.6% upside from the current price. This is a relatively professional model, and it has also been marked by Hashed as an academically validated model with strong historical relevance. However, it is somewhat biased to consider TVL as the sole factor. Discounted Cash Flow Method This valuation model is currently the most effective way to value Ethereum as a company, treating Ethereum's staking rewards as revenue and calculating its current value using the discounted cash flow (DCF) method. Hashed's calculation is Price × (1 + APR) ÷ (0.10 - 0.03), where 10% is the discount rate and 3% is the perpetual growth rate. This formula is clearly flawed; the actual result should be Price × APR × (1/1.07 + 1/1.07^2 + ... + 1/1.07^n) as n approaches infinity. Even using the formula provided by Hashed, this result cannot be calculated. If calculated with an annualized interest rate of 2.6%, the actual reasonable price should be around 37% of the current price. Valuation by price-to-sales ratio In Ethereum, the price-to-sales ratio (P/S ratio) refers to the ratio of market capitalization to annual transaction fee revenue. Since transaction fees ultimately go to validators, there is no price-to-earnings ratio (P/E ratio) for the network. Token Terminal uses this method for valuation, with 25 times earnings representing a growth-oriented tech stock valuation level, which Hashed calls the "industry standard for L1 protocol valuation." The model's calculation formula is Annual_Fees × 25 ÷ Supply, resulting in a price of $1285.7, representing a 57.5% downside from the current price. The two examples above show that Ethereum's price is severely overvalued using traditional valuation methods. However, Ethereum is clearly not an application, and in my opinion, this valuation method is flawed even in its underlying logic. On-chain total asset valuation This valuation model, while seemingly illogical at first glance, makes some sense upon closer examination. Its core argument is that for Ethereum to ensure network security, its market capitalization should match the value of all assets settled on it. Therefore, the calculation is simple: divide the total value of all assets on Ethereum, including stablecoins, ERC-20 tokens, NFTs, etc., by Ethereum's total supply. The result is $4923.5, representing a 62.9% upside from the current price. This is the simplest valuation model to date, but its core assumptions give the impression that something is wrong, though it's hard to pinpoint exactly what's wrong. Income bond model The only highly reliable valuation model among all available, which Hashed claims is favored by TradeFi analysts who assess cryptocurrencies as an alternative asset class, is one that values Ethereum as a yield bond. The calculation method divides Ethereum's annual revenue by its staking yield to calculate its total market capitalization, using the formula Annual_Revenue ÷ APR ÷ Supply. This yields a value of $1941.5, representing a 36.7% downside from the current price. The only instance, perhaps due to its widespread adoption in the financial sector and its perceived high reliability, is that Ethereum's price has been "undervalued" using traditional valuation methods. Therefore, this could be strong evidence that Ethereum is not a security. Valuing a public blockchain may require considering a variety of factors. The valuation system for public blockchain tokens may need to consider many factors. Hashed calculated a weighted average of the above 10 methods based on reliability, and the result was about $4,766. However, given that the calculation of the discounted cash flow method may be incorrect, the actual result may be slightly lower than this figure. If I were to value Ethereum, my core algorithm would likely focus on supply and demand. Since Ethereum is a "currency" with practical uses—whether paying gas fees, buying NFTs, or forming LPs—ETH is required. Therefore, it might be necessary to calculate a parameter based on network activity levels to measure the supply and demand of ETH over a period of time. This parameter would then be combined with the actual cost of executing transactions on Ethereum and compared to prices under similar historical parameters to arrive at a fair price. However, according to this method, if the growth in activity on Ethereum cannot keep up with the decline in costs, there is a reason why the price of ETH will not rise. In the past two years, the level of activity on Ethereum has actually been higher than that during the bull market in 2021 at some points, but due to the decline in costs, the demand for Ethereum is not high, resulting in an actual oversupply of Ethereum. However, the only thing that this valuation method, which compares with history, cannot take into account is Ethereum's potential. Perhaps at some point, when Ethereum experiences the same boom as when DeFi was emerging, we will need to factor in the "market-to-dream ratio".
Share
Author: PANews2025/12/01 07:30

Yearn Finance Exploit Drains yETH Pool, $3 Million Transferred
The post Yearn Finance Exploit Drains yETH Pool, $3 Million Transferred appeared on BitcoinEthereumNews.com. Key Points: Yearn Finance’s yETH product exploited, pool drained. Attacker transferred $3 million in ETH via Tornado Cash. Yearn’s V2 and V3 Vaults remain secure and unaffected. Yearn Finance, a leading DeFi protocol, suffered an exploit on December 1st, involving its yETH staking token that resulted in the loss of approximately $3 million in ETH. This security breach highlights vulnerabilities in outdated contracts and underscores the need for vigilant DeFi security practices, while Yearn Finance continues investigations to mitigate future risks. Yearn Finance Faces $3 Million Exploit Challenge Yearn Finance, a prominent DeFi protocol, disclosed that its yETH product was exploited, allowing an unrestrained minting of tokens. The attacker transferred 1,000 ETH ($3 million) to Tornado Cash. Multiple self-destructions of contracts post-transaction complicated the analysis of losses. Yearn assured users that its V2 and V3 Vaults remain secure, limiting the exploit’s reach to older contracts. Yearn is currently investigating the breach to determine the full extent and prevent future vulnerabilities. “We acknowledge the incident and are currently investigating it while affirming that our V2 and V3 Vaults remain secure and unaffected.” — Yearn Finance Team, Official Communication, Source Community reaction was mixed, with some users expressing concern over the continued use of outdated contracts. However, the absence of damage to current vaults mitigated severe panic among Yearn users and stakeholders. Previous Breaches and Ongoing DeFi Security Risks Did you know? Yearn Finance’s latest exploit mirrors a previous breach from April 2023, when about $10 million was taken using a similarly outdated contract. Ethereum (ETH) currently trades at $3,020.55 with a market cap of $364.57 billion, as per CoinMarketCap. Its trading volume over the past 24 hours sees a downturn of 11.98% at $11.16 billion. Recent ETH price activities include a 1.1% rise in 24 hours, a 7.31% weekly gain, and…
Share
Author: BitcoinEthereumNews2025/12/01 07:24

Yearn yETH was attacked, and approximately $3 million worth of ETH flowed into Tornado Cash.
PANews reported on December 1st that, according to The Block, Yearn Finance's aggregated staking token product yETH was attacked. The attacker exploited a vulnerability to mint almost unlimited yETH, depleting the pool's assets in a single transaction. On-chain data shows that the attacker subsequently transferred approximately 1,000 ETH (about $3 million) to the mixing protocol Tornado Cash. Multiple contracts used for the attack self-destructed after the transaction. The exact scale of the losses is currently unknown. Yearn stated that it is investigating the incident and that its V2 and V3 Vaults were unaffected. Yearn also confirmed that its Katana Vaults are all V3 versions and were not affected by the yETH attack.
Share
Author: PANews2025/12/01 07:14

$3 million in ETH sent to Tornado Cash following apparent attack on Yearn’s yETH
The complex attack took place in a single transaction, and appears to have involved liquid staking tokens from across the Ethereum ecosystem.
Share
Author: Coinstats2025/12/01 06:50

Ethereum’s Fusaka Upgrade May Enhance ETH Burn via L2-Mainnet Fee Ties
The post Ethereum’s Fusaka Upgrade May Enhance ETH Burn via L2-Mainnet Fee Ties appeared on BitcoinEthereumNews.com. The Ethereum Fusaka upgrade, scheduled for December 3, introduces EIP-7918 to link Layer-2 fees directly to mainnet gas costs, potentially increasing ETH burn through higher L2 contributions. This change, alongside throughput enhancements and raised gas limits, aims to boost network efficiency and user experience while sparking debates on long-term tokenomics. EIP-7918 establishes a baseline cost for L2 batch posting tied to mainnet execution, aligning secondary layer activity with Ethereum’s core fee mechanisms. Fusaka enhances overall performance with PeerDAS for better data throughput, reduced latency via preconfirmations, and a gas limit increase to 60 million. Corporate L2 projects like those from Coinbase and Robinhood may see elevated fee commitments, potentially amplifying ETH burn rates as adoption grows. Discover how the Ethereum Fusaka upgrade transforms L2 fees via EIP-7918, boosting ETH burn potential. Explore impacts on developers and users—stay ahead in crypto evolution today! What is the Ethereum Fusaka Upgrade? The Ethereum Fusaka upgrade represents a significant network evolution set for activation on December 3, designed to refine fee structures, enhance scalability, and improve accessibility. It primarily introduces EIP-7918, which ties Layer-2 solution costs to mainnet gas prices, creating a more integrated economic model. This adjustment, combined with other technical improvements, seeks to make Ethereum more efficient for everyday users and large-scale applications. How Does EIP-7918 Impact ETH Burn? EIP-7918 fundamentally alters the dynamics between Layer-2 chains and the Ethereum mainnet by imposing a minimum fee for batch posting that mirrors mainnet execution costs. Previously, L2 solutions contributed minimally to ETH burn rates because their base fees were negligible, limiting the overall impact of secondary layer activity on token deflation. Under this proposal, as L2 usage surges—driven by rollups and optimistic solutions—more ETH will be burned through aligned fee mechanisms, similar to the EIP-1559 model’s influence since 2021. Analysts, including those from…
Share
Author: BitcoinEthereumNews2025/12/01 04:51

Composite of ETH Valuation Models Places ETH Fair Value at $4,839: Analyst
The post Composite of ETH Valuation Models Places ETH Fair Value at $4,839: Analyst appeared on BitcoinEthereumNews.com. The native token of the Ethereum network, Ether (ETH), is undervalued in nine out of 12 commonly used valuation models, according to Ki Young Ju, a market analyst and CEO of crypto market analysis platform CryptoQuant. A composite “fair value” using all 12 valuation models prices ETH at about $4,836, an over 58% gain compared to its price at the time of this writing. Each valuation model was rated on a three-tiered scale for reliability, with three being the most reliable. Eight out of the 12 models feature a reliability rating of at least two. “These models were built by trusted experts across academia and traditional finance,” Ju said. 12 different ETH valuation models signal that ETH is undervalued at current market prices just north of $3,000. Source: ETHval The App Capital valuation model, which accounts for total on-chain assets, including stablecoins, ERC-20 tokens, non-fungible tokens (NFTs), real-world tokenized assets (RWAs), and bridged assets, prices ETH at a fair value of $4,918, according to ETHval. Using Metcalfe’s Law, which states that the value of a network grows in proportion to the square of real active users or the number of nodes in the network, projects an ETH price of $9,484, meaning the asset is over 211% undervalued, according to the model. Valuing ETH through the Layer-2 (L2) framework, which accounts for the total value locked (TVL) in Ethereum’s layer-2 scaling network ecosystem, projects a price of $4,633 per ETH, meaning that ETH is about 52% undervalued. The composite fair value of ETH over one year. Source: ETHval The Ethereum community and analysts continue to debate how to value the world’s first smart contract platform properly, with many saying that traditional valuation models are not sufficient to value nascent digital assets and decentralized blockchain networks. Related: Ethereum ICO whale cashes out…
Share
Author: BitcoinEthereumNews2025/12/01 03:23
Fidelity’s On-Chain Cash Fund Explodes Past $250M as ETH Surges
Fidelity’s tokenized money-market fund on Ethereum has quietly crossed the $250 million mark while ETH itself defends a fresh breakout above $3,000. Together, the fund’s inflows and the chart’s bullish structure underline how capital and price action are now aligning on the same chain.Fidelity Tokenized Ethereum Fund Crosses $250M AUMFidelity’s tokenized money-market fund built on Ethereum has topped $250 million in assets under management (AUM), according to crypto trader Cryptorand. In a post on X, trader Rand said the fund passed the $250 million mark in November 2025. The chart shows a flat line until September. Then the AUM spikes sharply. After that, the total climbs in a steady stair-step pattern and moves past $250 million in late November.The fund launched earlier in 2025 as part of Fidelity’s push into on-chain financial products. It gives investors exposure to short-term money-market yields while settlement and ownership records live on Ethereum. This structure replaces off-chain transfer steps with direct, wallet-to-wallet updates on a shared ledger. As a result, AUM reporting tracks tokenized positions instead of traditional omnibus accounts.The light green trend on the chart signals persistent inflows since September. The first jump takes AUM from $0 to about $200 million. Next, stepwise increases lift the total near $225 million by early November. Finally, the fund expands again and crosses $250 million before month end. Rand also noted RWA (real-world asset) tokenization as a driver of the growth, tying the jump in AUM to broader on-chain demand for yield-bearing instruments.Ethereum hosts several tokenized funds, but this milestone highlights how regulated asset managers are deploying capital into yield products that run financial primitives in code. Meanwhile, Ethereum remains the base layer used for asset state updates, wallet settlement, and composable collateral logic, positioning it at the center of current tokenized money-market expansion.Ethereum Forms Bullish Breakout-Retest Pattern, Analyst SaysEthereum (ETH) is tracing a textbook bullish structure, chart analyst James Bull said on X. His 4-hour TradingView chart shows ETH breaking out of a downtrend, pulling back to the former resistance line and holding it as support near $3,000.Ethereum Bullish Breakout Retest Setup On 4 Hour Chart. Source: Jamesbull1234From that base, Bull maps a rising trendline with higher lows and projected higher highs. Two yellow circles mark expected retests of the trendline, followed by an arrow toward the mid-$3,000 area, outlining a potential continuation of the move if support keeps holding.
Share
Author: Coinstats2025/12/01 03:16

Ethereum koers richting $4.500 door 55% Pectra effect en herstel huidige structuur?
De recente daling van de Ethereum exchange reserves en een stevige koersbeweging in de afgelopen maand vormen op dit moment de belangrijkste aanjagers voor het marktsentiment. ETH liet een koersdaling van circa 21% zien in de afgelopen dertig dagen. Tegelijk toont de grafiek hogere bodems, wat wijst op een sterkere marktstructuur. Deze combinatie wordt ondersteund door een bullish MACD crossover. Duwt dit de Ethereum koers weer omhoog? Check onze Discord Connect met "like-minded" crypto enthousiastelingen Leer gratis de basis van Bitcoin & trading - stap voor stap, zonder voorkennis. Krijg duidelijke uitleg & charts van ervaren analisten. Sluit je aan bij een community die samen groeit. Nu naar Discord De Ethereum koers reageert op de dalende exchange reserves De daling van de exchange supply zorgt ervoor dat grote verkoopblokken minder zichtbaar worden. Dit kan leiden tot een stabieler koersverloop wanneer Ethereum belangrijke zones nadert. De supply in dit soort datapunten is eenvoudig te controleren via bekende on-chain datasets. Een lagere supply op exchanges betekent dat de bears minder directe verkoopmacht hebben, omdat zij eerst de ETH tokens moeten verplaatsen voordat zij deze kunnen verkopen. De Ethereum grafiek laat daarnaast een reeks van hogere bodems zien. Dit gebeurt meestal wanneer de bulls telkens iets boven het vorige dieptepunt instappen. In dit geval lag een eerdere bodem rond het gebied net onder $2.800. Daarna kwam er een opwaartse reactie richting een afgerond koersgebied rond $3.000. Dit zijn geen actuele standen, maar afgeronde niveaus die bij recente prijszones aansluiten. De prijszone rond $3.058, die in eerdere koersbewegingen meerdere afwijzingen gaf, blijft belangrijk. De markt reageerde daar in het verleden met duidelijke candles die telkens naar beneden draaiden. Wanneer een markt meerdere keren op exact dezelfde plek draait, kan dat duiden op een sterke concentratie van verkooporders. Als deze zone overtuigend wordt terugveroverd, ontstaat er ruimte richting een volgend prijsgebied dat eerder rond $3.600 lag. Ook deze niveaus blijven benaderingen op basis van eerdere ETH prijsreacties. Technische structuur ondersteunt de ETH koers op de middellange termijn De MACD crossover is onderdeel van de huidige technische opbouw. Deze indicator is een momentum tool die het verschil tussen twee gemiddelden meet. Wanneer de lijn vanuit een lagere zone omhoog kruist, wijst dit op een verandering in het tempo van de koersbeweging. Het is een controleerbare indicator die in de huidige Ethereum markt scherp omhoog draait. De ETH grafiek laat daarnaast een duidelijk regressie kanaal zien dat lange tijd neerwaarts gericht was. Ethereum beweegt inmiddels dichter bij de bovenkant van dat kanaal. Dit geeft aan dat bulls sterker worden binnen dezelfde structuur. Wanneer een asset langere tijd onder druk staat en vervolgens richting de bovenkant van een trendkanaal klimt, wijst dat vaak op het einde van een fase waarin de bears de overhand hadden. Er is ook een historische Ethereum vergelijking gemaakt door een marktanalist. Deze keek naar de Pectra upgrade in mei 2025. Tijdens die periode steeg Ethereum in 35 dagen met 55% en in 109 dagen met 168%. Dit zijn controleerbare cijfers uit eerdere ETH cycli. Zijn analyse legt vooral de nadruk op hoe een grote upgrade soms samenvalt met een koersbeweging die al zichtbaar was in de grafiek. Binnenkort volgt de FUSAKA upgrade op 3 december 2025. Dezelfde crypto-analist koppelt deze gebeurtenis aan een projectie die in de buurt ligt van eerdere doelzones. Zijn model geeft een mogelijke stijging richting een afgerond koersniveau rond $4.500 binnen vijf weken na de upgrade. Hoewel dit een externe verwachting is, sluit het wel aan bij de Ethereum structuur die momenteel zichtbaar is. Er bestaat daarnaast een latere projectie richting $7.800, maar die valt buiten de huidige tijdsperiode. $ETH Could Skyrocket to $7.8K After FUSAKA Upgrade – History Shows The last Ethereum Pectra Upgrade on 7 May 2025 triggered a massive move: ✅ +55% in 35 days ✅ +168% in 109 days What’s next? The FUSAKA Upgrade is scheduled for 3 December 2025. If history repeats: Target… pic.twitter.com/ojZXLQSYWZ — Crypto Patel (@CryptoPatel) November 29, 2025 Ethereum marktstructuur richting einde van het jaar De combinatie van dalende exchange reserves, een bullish MACD crossover en duidelijke hogere bodems geeft Ethereum een steviger fundament dan enkele weken geleden. De technische zones rond $3.058 en $3.600 blijven belangrijk, omdat de ETH grafiek daar eerder sterke reacties liet zien. Wanneer de bulls deze prijszones blijven verdedigen, blijft het scenario voor een verdere opwaartse koersbeweging richting een afgerond gebied rond $4.200 overeind. De upgrade planning en de huidige momentumstructuur ondersteunen dit beeld, zonder dat er sprake is van speculatieve aannames. Ethereum beweegt hiermee in een fase waarin de technische opbouw en supplydynamiek elkaar versterken. Best wallet - betrouwbare en anonieme wallet Best wallet - betrouwbare en anonieme wallet Meer dan 60 chains beschikbaar voor alle crypto Vroege toegang tot nieuwe projecten Hoge staking belongingen Lage transactiekosten Best wallet review Koop nu via Best Wallet Let op: cryptocurrency is een zeer volatiele en ongereguleerde investering. Doe je eigen onderzoek. Het bericht Ethereum koers richting $4.500 door 55% Pectra effect en herstel huidige structuur? is geschreven door Dirk van Haaster en verscheen als eerst op Bitcoinmagazine.nl.
Share
Author: Coinstats2025/12/01 03:16