Pepe, Bonk Lead Memecoin Recovery With Double-Digit Pumps — Is Memecoin Mania Back?

Demand in the meme coin space came back suddenly after the total memecoin capitalization rose about 5.7% to $51.6 billion in the last 24 hours.
Pepe leads the dance with a 11% jump in the last 24 hours, Bonk follows with 10%, and Shiba Inu at $4.3%.
The meme coin space is outperforming the broader crypto market, as it jumped on 1% to a $3.23 trillion market capitalization, which now signals retail and institutional capital shifts to speculative assets.
This surge comes as Bitcoin continues to grind higher for the start of the year, now up over 1% to trade well above the $92,500 zone.
The recovery is not limited to meme coins; other top altcoins, including Hyperliquid, Hedera, Aster, and XRP, have also surged by roughly 5% over 24 hours, according to Coingecko data.
Moreover, historical patterns, according to Coingecko, show memecoins rising often precede altcoin recoveries, reflating retail enthusiasm before cascading into established protocols.
Is the memecoin mania back, or is this just a short-lived surge?
Pepe Price Shows Signs Of A Continued Surge
The Pepe price pumped 11.5% in the past 24 hours to trade at $0.000007027 as of 12:03 a.m. EST, with trading volume soaring 30% to $1.5 billion.
In the 3-day chart, the PEPE price shows signs of a recovery in the last two candles, now up 74% in the last two weeks. This surge has now pushed the price of Pepe towards a breakout, as it closes in on the upper boundary of the falling channel pattern and the 50-day Simple Moving Average (SMA) at $0.000007335.
The Relative Strength Index (RSI), currently at 61.85 and still climbing, shows that buyers have control of the price without being overbought. This level indicates that buyers still have space to buy before the asset becomes overbought.
Meanwhile, the Moving Average Convergence Divergence (MACD) for the price of Pepe shows a bullish crossover, after the blue MACD line has crossed above the orange signal line.
Green bars on the histogram are also forming above the neutral line, a signal of positive momentum to the upside.
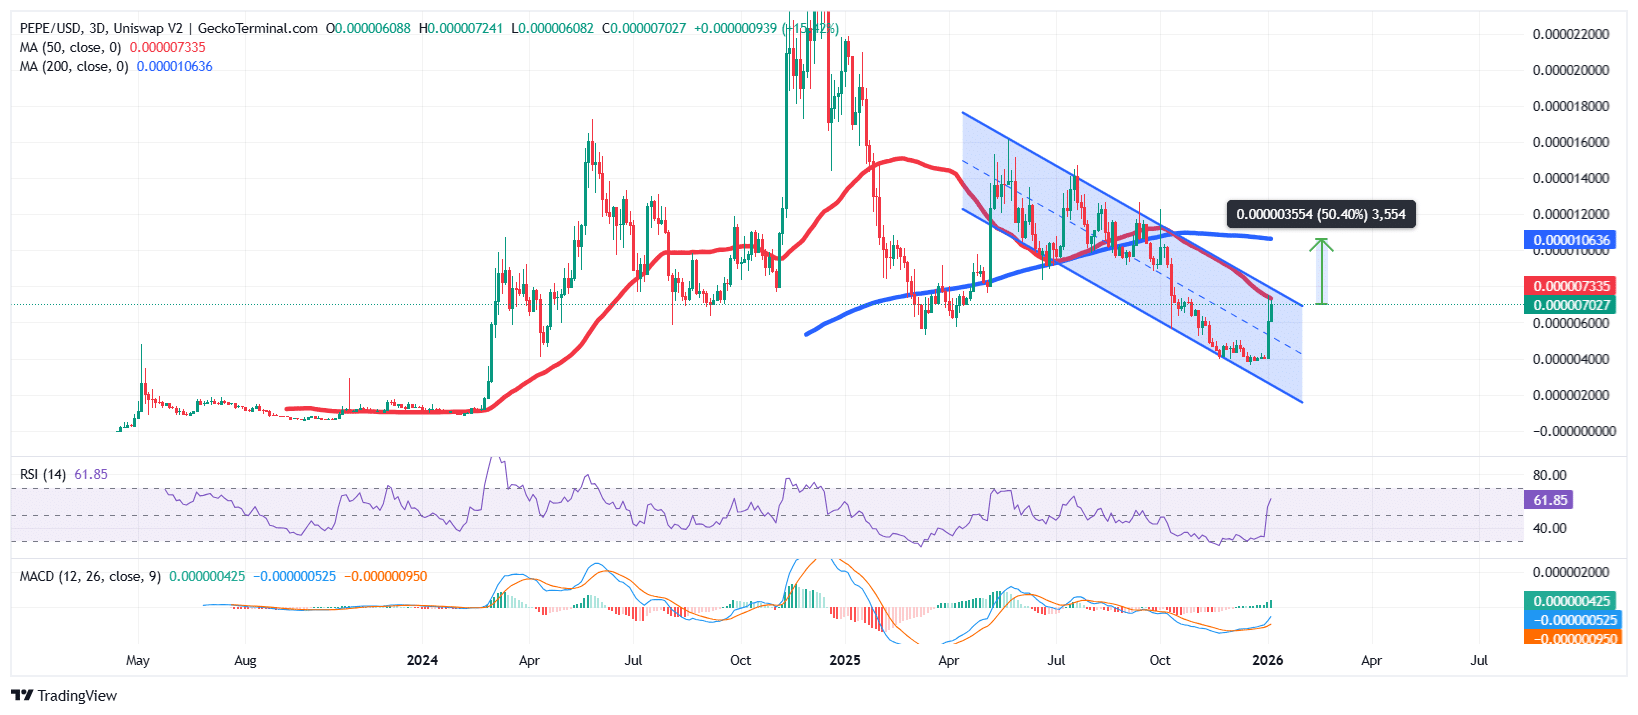 PEPE/USD Chart Analysis Source: GeckoTerminal
Based on the PEPE/USD chart analysis, PEPE is poised for another surge past the 50-day SMA, targeting the 200-day SMA at $0.0000106, a 50.40% surge from the current level.
If the RSI continues to surge, the asset could become overbought in the coming days, risking a drop to the long-term and previous support zone around $0.0000056.
Bonk Price On The Verge Of A Breakout As Bulls Target A 75% Surge
The Bonk price is now up 45% in the last week to trade at $0.00001194 as of 12:28 a.m. EST on a 128% jump in daily trading volume to $731 million.
This notable surge is as the BONK price prepares for a breakout above a falling wedge pattern, flashing a bullish upward recovery.
The RSI has crossed above the 50-midline level from the 30-overbought zone, currently at 53.29 and climbing, suggesting the asset is picking up buying pressure without being overbought. This suggests space for the bulls to still push BONK up.
Moreover, the MACD has also turned positive, with the blue MACD line well above the orange signal line.
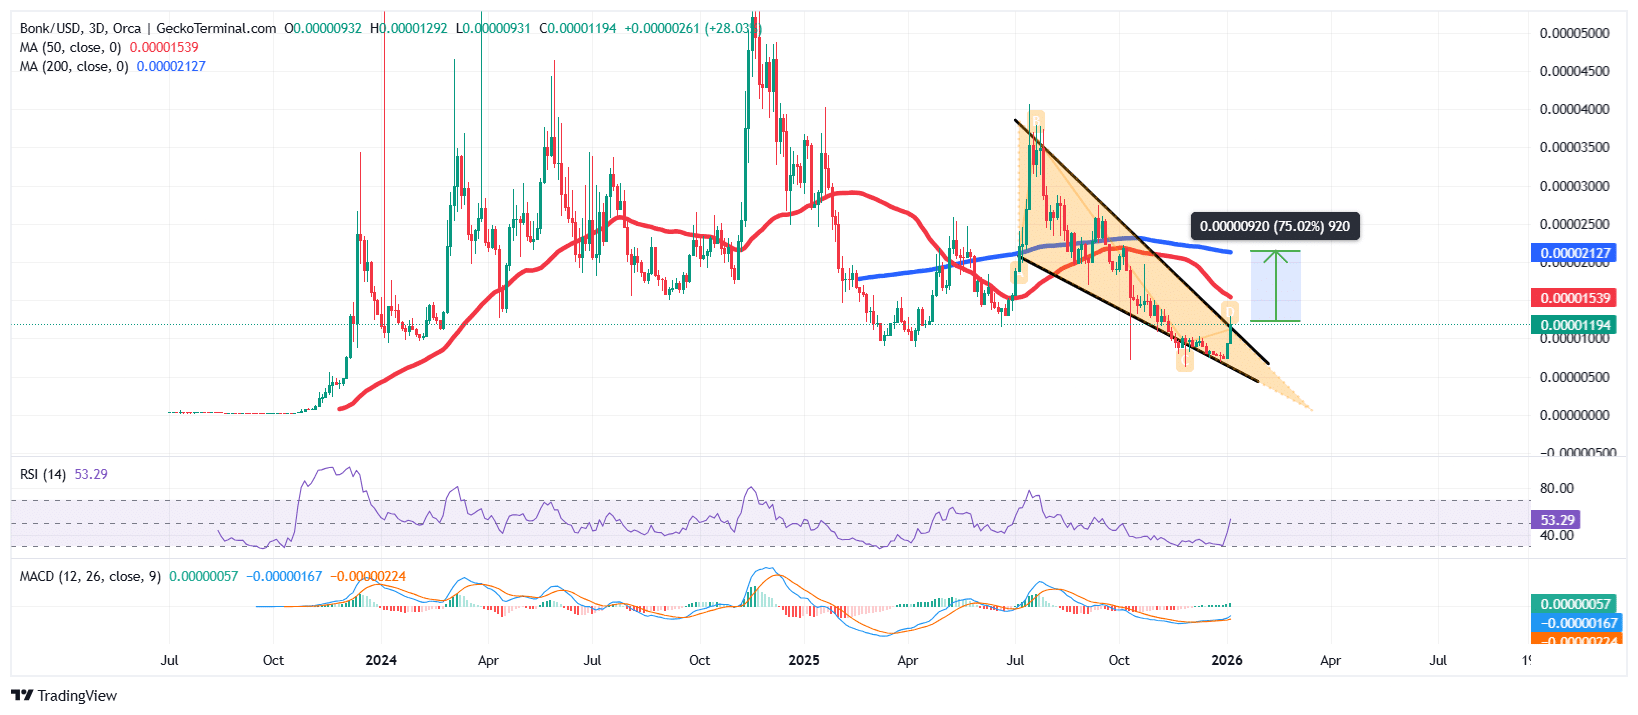 BONK/USD Chart Analysis Source: GeckoTerminal
A continued surge and a breakout above the wedge could push the price of BONK past the 50-day SMA ($0.00001539) to climb another 75% from the current level, targeting the 200-day SMA at $0.00002127 in the long term.
However, investors should be cautious as investors who bought on the $0.00000778 support may start booking profits. In this scenario, bears may drive BON towards a retracement back to this support area.
Related News:


You May Also Like

Smart Buyers Rush to BlockDAG for 85x Instant ROI While XRP & Ethereum Move Sideways

The Hidden Cost of Choosing the Wrong Media Outlets