Solana is sitting on a critical support level following a period of muted volatility and sideways consolidation. With multiple technical confluences now in play, the market appears primed for a decisive breakout,or breakdown. The current structure suggests that price is…Solana is sitting on a critical support level following a period of muted volatility and sideways consolidation. With multiple technical confluences now in play, the market appears primed for a decisive breakout,or breakdown. The current structure suggests that price is…

Solana holding key support: breakout likely if bulls step in

Solana is sitting on a critical support level following a period of muted volatility and sideways consolidation. With multiple technical confluences now in play, the market appears primed for a decisive breakout,or breakdown. The current structure suggests that price is coiling, and the next move could mark a major directional shift.

Solana (SOL) has shown signs of hesitation, yet the support zone continues to hold firm. This combination often precedes a volatility expansion, and Solana is approaching that inflection point. Traders should be watching closely, as the resolution of this range will offer clarity on the next trend direction.

Key technical points,

  • VWAP Support: The VWAP anchored from the cycle low is acting as dynamic support under current price action.
  • 143 Daily Support: A high time frame level that has repeatedly held, providing strong market structure.
  • Swing Low Structure: Price is respecting a cluster of key swing lows, forming a significant demand area
Solana holding key support: breakout likely if bulls step in - 1

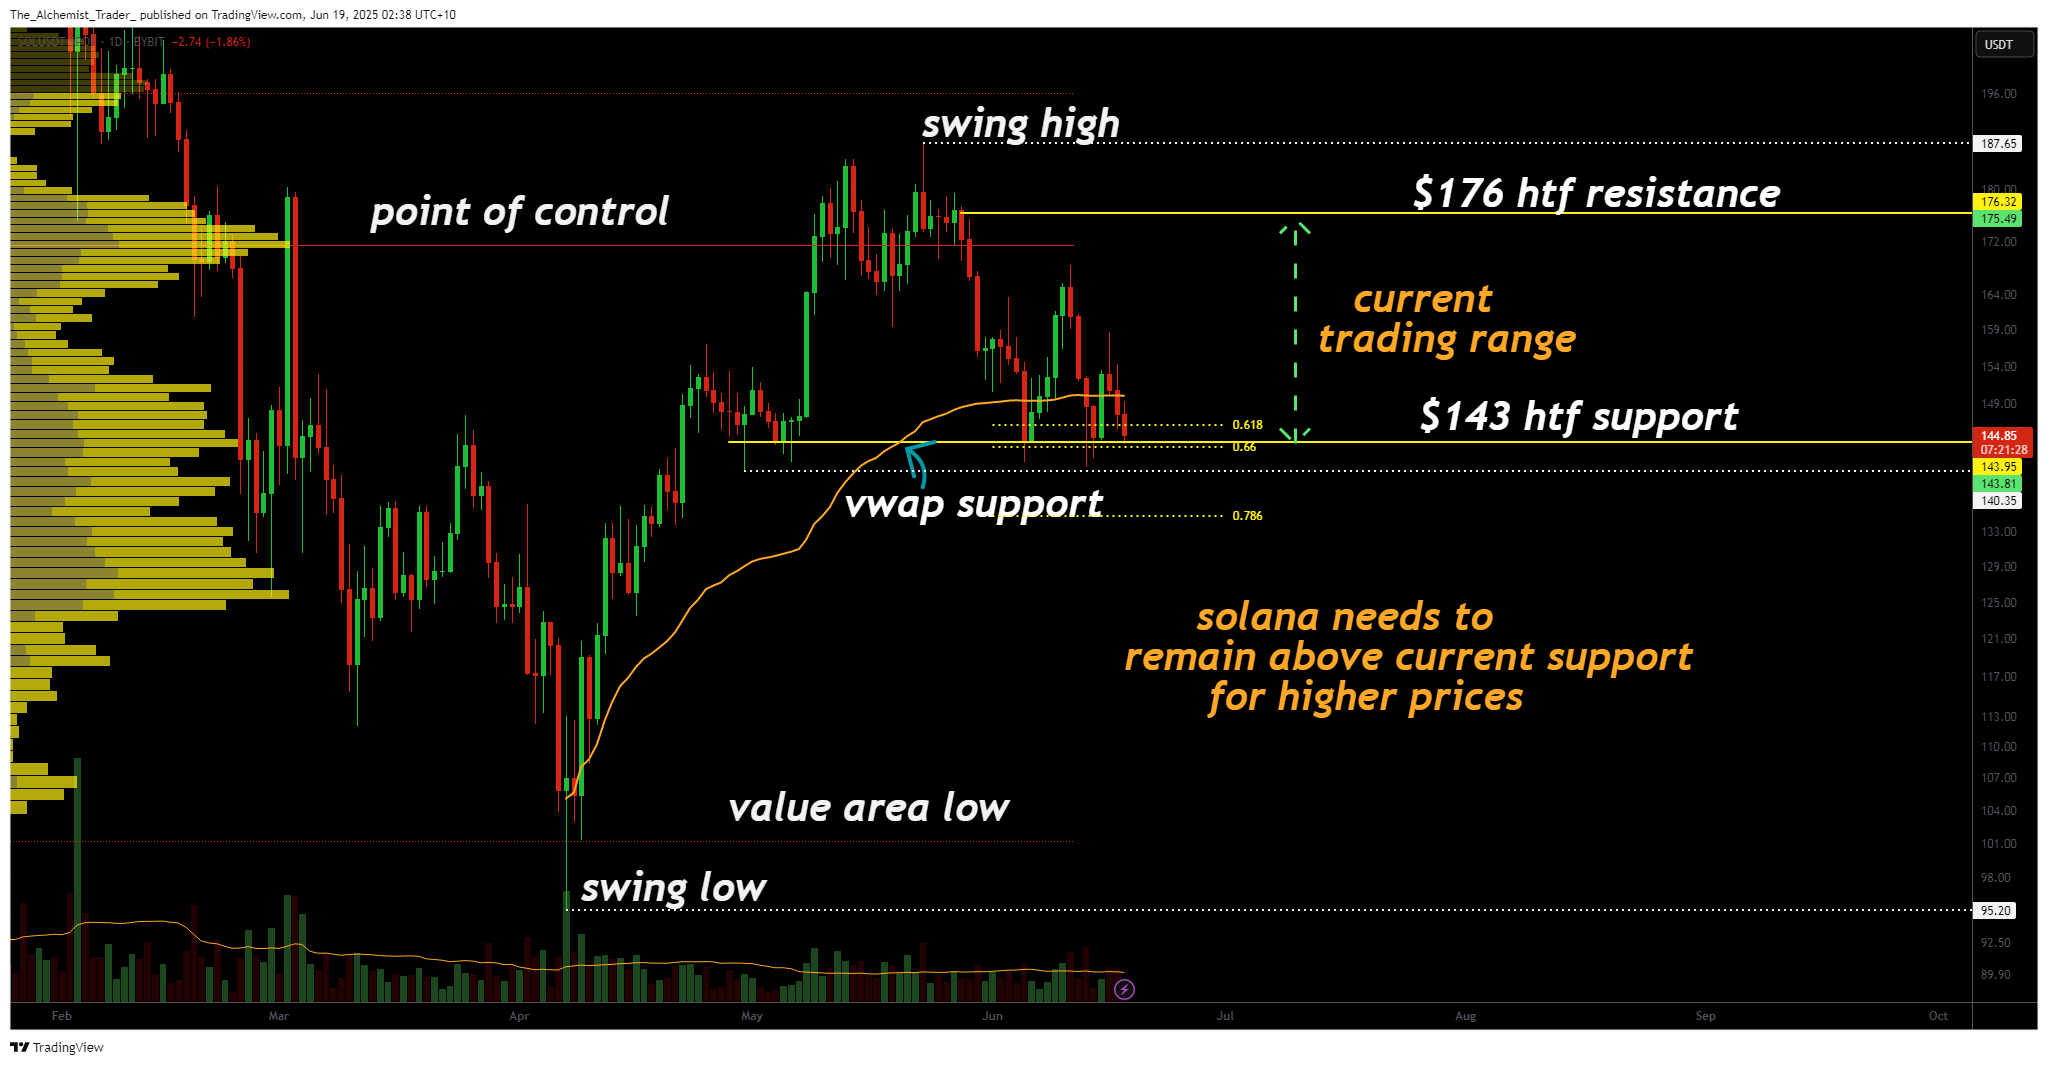
From a technical standpoint, Solana’s current chart positioning is notable. The anchored VWAP from the cycle low is sitting directly below current price and aligns with the 143 daily support level, creating a strong confluence zone. Additionally, multiple prior swing lows form a local demand cluster, suggesting this area has attracted buyers in the past.

Despite this, price remains in no man’s land. Solana has not demonstrated impulsive follow-through in either direction. A decisive breakout above the current range highs could spark a run toward the next major resistance near the $170 region. Conversely, a failure to hold this support could trigger a liquidity sweep below, exposing the asset to a deeper pullback before any recovery attempt.

It’s also worth noting the lack of volume accompanying recent moves. Without meaningful participation, any breakout risks becoming a false move or weak trend extension. Traders should exercise caution and wait for confirmation through volume expansion and structural breaks before committing to directional setups.

What to expect in the coming price action

As long as Solana holds above this high-confluence support zone, the probability of a bounce remains slightly elevated. However, in the absence of a strong reaction or breakout, the range may persist. A breakdown below this level would shift bias to the downside, targeting lower support zones. The next few sessions are critical, stay patient and let the chart confirm the move.

Market Opportunity
PlaysOut Logo
PlaysOut Price(PLAY)
$0.03225
$0.03225$0.03225
+3.93%
USD
PlaysOut (PLAY) Live Price Chart
Disclaimer: The articles reposted on this site are sourced from public platforms and are provided for informational purposes only. They do not necessarily reflect the views of MEXC. All rights remain with the original authors. If you believe any content infringes on third-party rights, please contact service@support.mexc.com for removal. MEXC makes no guarantees regarding the accuracy, completeness, or timeliness of the content and is not responsible for any actions taken based on the information provided. The content does not constitute financial, legal, or other professional advice, nor should it be considered a recommendation or endorsement by MEXC.

You May Also Like

Russia’s Central Bank Prepares Crackdown on Crypto in New 2026–2028 Strategy

Russia’s Central Bank Prepares Crackdown on Crypto in New 2026–2028 Strategy

The Central Bank of Russia’s long-term strategy for 2026 to 2028 paints a picture of growing concern. The document, prepared […] The post Russia’s Central Bank Prepares Crackdown on Crypto in New 2026–2028 Strategy appeared first on Coindoo.
Share
Coindoo2025/09/18 02:30
Japanese Yen rises on safe-haven demand and intervention concerns

Japanese Yen rises on safe-haven demand and intervention concerns

The post Japanese Yen rises on safe-haven demand and intervention concerns appeared on BitcoinEthereumNews.com. The Japanese Yen (JPY) attracts some buyers at the
Share
BitcoinEthereumNews2025/12/22 11:49
Cryptos Signal Divergence Ahead of Fed Rate Decision

Cryptos Signal Divergence Ahead of Fed Rate Decision

The post Cryptos Signal Divergence Ahead of Fed Rate Decision appeared on BitcoinEthereumNews.com. Crypto assets send conflicting signals ahead of the Federal Reserve’s September rate decision. On-chain data reveals a clear decrease in Bitcoin and Ethereum flowing into centralized exchanges, but a sharp increase in altcoin inflows. The findings come from a Tuesday report by CryptoQuant, an on-chain data platform. The firm’s data shows a stark divergence in coin volume, which has been observed in movements onto centralized exchanges over the past few weeks. Bitcoin and Ethereum Inflows Drop to Multi-Month Lows Sponsored Sponsored Bitcoin has seen a dramatic drop in exchange inflows, with the 7-day moving average plummeting to 25,000 BTC, its lowest level in over a year. The average deposit per transaction has fallen to 0.57 BTC as of September. This suggests that smaller retail investors, rather than large-scale whales, are responsible for the recent cash-outs. Ethereum is showing a similar trend, with its daily exchange inflows decreasing to a two-month low. CryptoQuant reported that the 7-day moving average for ETH deposits on exchanges is around 783,000 ETH, the lowest in two months. Other Altcoins See Renewed Selling Pressure In contrast, other altcoin deposit activity on exchanges has surged. The number of altcoin deposit transactions on centralized exchanges was quite steady in May and June of this year, maintaining a 7-day moving average of about 20,000 to 30,000. Recently, however, that figure has jumped to 55,000 transactions. Altcoins: Exchange Inflow Transaction Count. Source: CryptoQuant CryptoQuant projects that altcoins, given their increased inflow activity, could face relatively higher selling pressure compared to BTC and ETH. Meanwhile, the balance of stablecoins on exchanges—a key indicator of potential buying pressure—has increased significantly. The report notes that the exchange USDT balance, around $273 million in April, grew to $379 million by August 31, marking a new yearly high. CryptoQuant interprets this surge as a reflection of…
Share
BitcoinEthereumNews2025/09/18 01:01