Next XRP ‘Monster Leg’ Will Start No Earlier Than 2026: Analyst
An XRP/BTC long-term chart shared by pseudonymous market technician Dr Cat (@DoctorCatX) points to a delayed—but potentially explosive—upswing for XRP versus Bitcoin, with the analyst arguing that “the next monster leg up” cannot begin before early 2026 if key Ichimoku conditions are to be satisfied on the highest time frames.
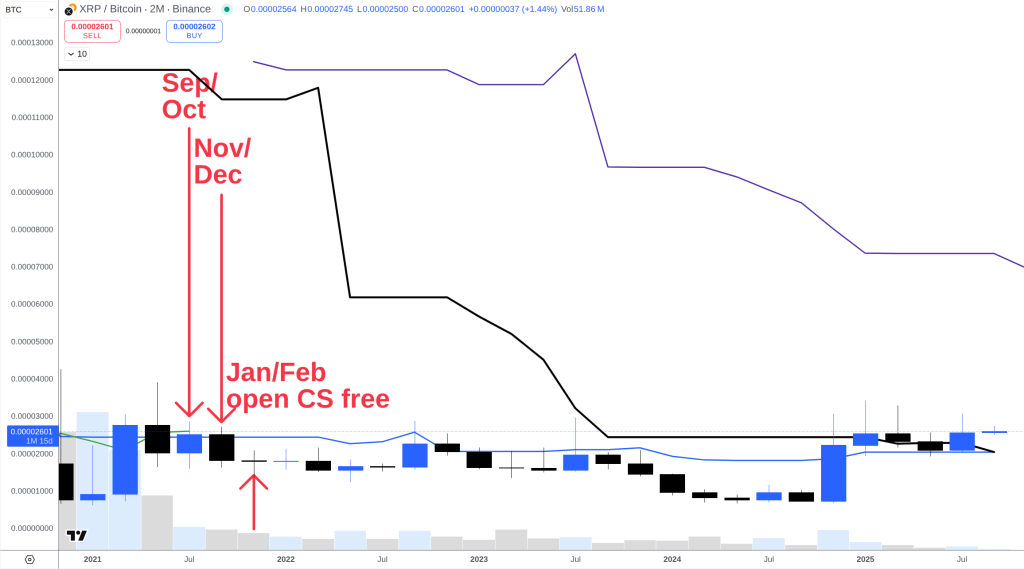
Posting a two-month (2M) XRP/BTC chart with Ichimoku overlays and date markers for September/October, November/December and January/February, Dr Cat framed the setup around the position of the Chikou Span (CS) relative to price candles and the Tenkan-sen. “Based on the 2M chart I expect the next monster leg up to start no earlier than 2026,” he wrote. “Because the logical time for CS to get free above the candles is Jan/Feb 2026 on an open basis and March 2026 on a close basis, respectively.”
XRP/BTC Breakout Window Opens Only In 2026
In Ichimoku methodology, the CS—price shifted back 26 periods—clearing above historical candles and the Tenkan-sen (conversion line) is used to confirm the transition from equilibrium to trending conditions. That threshold, in Dr Cat’s view, hinges on XRP/BTC defending roughly 2,442 sats (0.00002442 BTC). “As you see, the price needs to hold 2442 so that CS is both above the candles and Tenkan Sen,” he said.
Should that condition be met, the analyst sees the market “logically” targeting the next major resistance band first around ~7,000 sats, with an extended 2026 objective in a 7,000–12,000 sats corridor on the highest time frames. “If that happens, solely looking at the 2M timeframe the logical thing is to attack the next resistance at ~7K,” he wrote, before adding: “Otherwise on highest timeframes everything still looks excellent and points to 7K–12K in 2026, until further notice.”
The roadmap is not without nearer-term risks. Dr Cat flagged a developing signal on the weekly Ichimoku cloud: “One more thing to keep an eye on till then: the weekly chart. Which, if doesn’t renew the yearly high by November/December will get a bearish kumo twist. Which still may not be the end of the world but still deserves attention. So one more evaluation is needed at late 2025 I guess.” A bearish kumo twist—when Senkou Span A crosses below Senkou Span B—can foreshadow a medium-term loss of momentum or a period of consolidation before trend resumption.
The discussion quickly turned to the real-world impact of the satoshi-denominated targets. When asked what ~7,000 sats might mean in dollar terms, the analyst cautioned that the conversion floats with Bitcoin’s price but offered a rough yardstick for today’s market. “In current BTC prices are roughly $7.8,” he replied. The figure is illustrative rather than predictive: XRP’s USD price at any future XRP/BTC level will depend on BTC’s own USD value at that time.
The posted chart—which annotates the likely windows for CS clearance as “Jan/Feb open CS free” and “March close” following interim checkpoints in September/October and November/December—underscores the time-based nature of the call. On multi-month Ichimoku settings, the lagging span has to “work off” past price structure before a clean upside trend confirmation is possible; forcing the move earlier would, in this framework, risk a rejection back into the cloud or beneath the Tenkan-sen.
Contextually, XRP/BTC has been basing in a broad range since early 2024 after a multi-year downtrend from the 2021 peak, with intermittent upside probes failing to reclaim the more consequential resistances that sit thousands of sats higher. The 2,442-sats area Dr Cat highlights aligns with the need to keep the lagging span above both contemporaneous price and the conversion line, a condition that tends to reduce whipsaws on very high time frames.
Whether the market ultimately delivers the 7,000–12,000 sats advance in 2026 will, by this read, depend on two things: XRP/BTC’s ability to hold above the ~2,442-sats pivot as the calendar turns through early 2026, and the weekly chart avoiding or quickly invalidating a bearish kumo twist if new yearly highs are not set before November/December. “If that happens… the logical thing is to attack the next resistance at ~7K,” Dr Cat concludes, while stressing that the weekly cloud still “deserves attention.”
As with any Ichimoku-driven thesis, the emphasis is on alignment across time frames and the interaction of price with the system’s five lines—Tenkan-sen, Kijun-sen, Senkou Spans A and B (the “kumo” cloud), and the Chikou Span. Dr Cat’s thread leans on the lagging span mechanics to explain why an earlier “monster leg” is statistically less likely, and why the second half of 2025 will be a critical checkpoint before any 2026 trend attempt.
For now, the takeaway is a timeline rather than an imminent trigger: the analyst’s base case defers any outsized XRP outperformance versus Bitcoin until after the CS clears historical overhead in early 2026, with interim monitoring of the weekly cloud into year-end. As he summed up, “On highest timeframes everything still looks excellent… until further notice.”
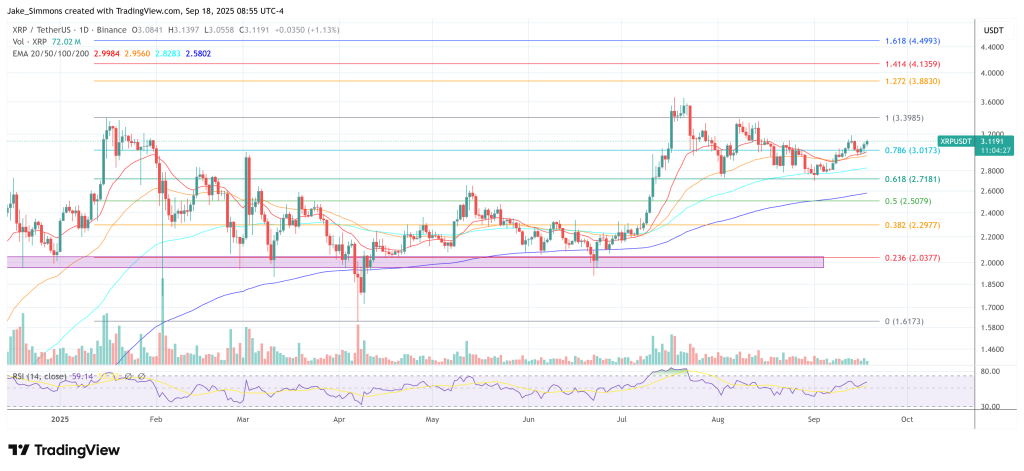
At press time, XRP traded at $3.119.


You May Also Like

ASML (ASML) Stock; Slips as High-NA Chips Near First Production Milestone

China Nabs Another Huione Group Core Member in Cambodia Extradition