Will XRP price break above the symmetrical triangle as the daily MACD turns bullish?
XRP price is at $1.3575 on April 14, down 1.32% on the session, as a symmetrical triangle converges toward its apex on the daily chart. A daily MACD bullish crossover has printed simultaneously, with the histogram turning positive for the first time in weeks, adding momentum confirmation to a pattern that has been compressing price since early March.
- XRP price is trading at $1.3575 on April 14, down 1.32%, as a symmetrical triangle tightens on the daily chart with the upper descending trendline from the February highs and the lower ascending trendline from the March lows converging at the apex.
- The daily MACD (12,26,9) has produced a bullish crossover with the histogram at +0.0060, while the MACD line at -0.0112 has crossed above the signal at -0.0171. Both lines remain below zero.
- A daily close above the SMA 50 at $1.3792 confirms a triangle breakout and opens $1.5625 as the next resistance; a daily close below the lower trendline near $1.30 invalidates the bull case.
XRP (XRP) price is at $1.3575 on April 14, with 24-hour trading volume of $2.24 billion, as the daily chart shows a symmetrical triangle pattern compressing price action between two converging trendlines since early March. The upper descending trendline connects the February highs above $1.60, and the lower ascending trendline runs from the March lows around $1.20. The full MA ribbon sits above price: SMA 20 at $1.3398, SMA 50 at $1.3792, SMA 100 at $1.5625, and SMA 200 at $1.9222, forming overhead resistance at each level. Price is at the apex of the triangle, forcing an imminent directional resolution.
Symmetrical Triangle at the Apex as MACD Prints a Daily Bullish Crossover
The symmetrical triangle on the daily chart reflects the market’s indecision since March, with sellers unable to push XRP below the ascending lower trendline and buyers unable to break through the descending upper trendline. Each successive high has been lower and each successive low has been higher, compressing the range toward a convergence point that is now directly at price. Apex-level compression in symmetrical triangles typically precedes a strong directional move, and the volume context during the pattern matters: declining volume inside the triangle has been followed by an expansion of volume on the breakout in prior XRP patterns.
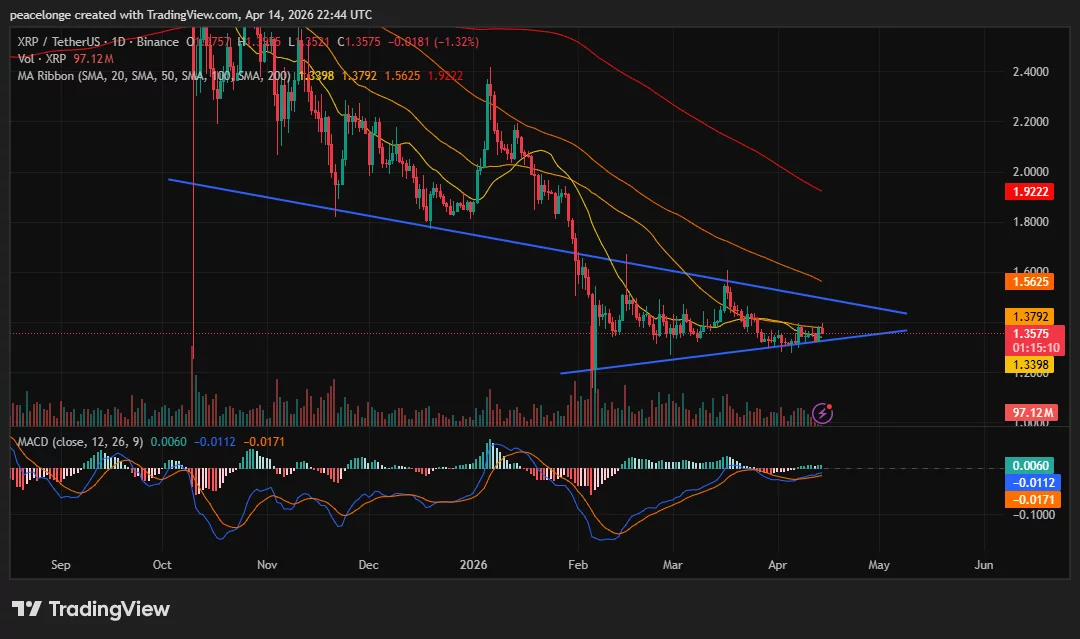
The MACD (12,26,9) has produced a bullish crossover simultaneously, with the MACD line crossing above the signal at the daily close. The histogram reads +0.0060, a positive reading for the first time since the pattern began. Both lines remain below zero, which means the macro trend is still bearish, but the crossover inside the triangle at the apex is the most constructive shortterm momentum signal XRP has produced in the current consolidation period. A KuCoin technical analysis published on April 8 noted that the MACD bullish crossover in XRP, when accompanied by expanding histogram bars, “could be a potential trend reversal signal” within the broader downtrend.
Key Levels: Support, Resistance, and Price Targets
The SMA 20 at $1.3398 is the immediate dynamic support, sitting just below current price. A daily close below $1.3398 signals that the SMA has failed to act as a floor and brings the lower trendline of the triangle near $1.30 into focus as the last structural support.
On the upside, the SMA 50 at $1.3792 is the first resistance and the level that must be cleared on a daily close basis to confirm a triangle breakout. A confirmed breakout above $1.3792 opens $1.5625 as the next target, where the SMA 100 sits. The extended bull case points to $1.9222, the SMA 200 level and the last major overhead reference before the February highs.
A daily close below the lower trendline near $1.30 breaks the symmetrical triangle structure and exposes $1.20 as the next support, consistent with the 1.0 Fibonacci level identified by analysts as the key floor below the current pattern.
Invalidation: a daily close below $1.30.
On-Chain and Market Data Context
XRP perpetual futures open interest fell sharply from a peak of $10.94 billion in July 2025 to approximately $2.45 billion currently, per Coinglass data, reflecting a significant deleveraging of speculative positioning over the past nine months. This reduction in open interest reduces the risk of a liquidation-driven breakdown and creates a cleaner setup for a technical breakout on lower leverage. XRP ETF inflows recorded approximately $3.3 million in net inflows on April 12, notably outperforming Bitcoin and Ethereum ETFs on the same session despite broader risk-off conditions.
The SEC CLARITY Act roundtable scheduled for April 16 is a nearterm catalyst that could introduce fresh directional volatility for XRP. The bill, which would establish XRP’s digital commodity status as permanent federal law, is expected to dominate market commentary heading into the session.
If XRP holds above $1.3398 on a daily close basis and the MACD histogram continues to expand, a test of the symmetrical triangle upper trendline and SMA 50 at $1.3792 becomes the primary nearterm target, with $1.5625 opening on a confirmed breakout above it.


You May Also Like

Cathie Wood’s ARK Invest Buys $13.7M in Circle Shares While Selling Robinhood Stock

The changing face of elder care in Malaysia — Sayed Mohammad Reza Yamani Sayed Umar

One Of Frank Sinatra’s Most Famous Albums Is Back In The Spotlight