

Bitcoin Tanks 42% From Peak While S&P 500 Hits New All-Time High – What the Chart Just Revealed
- Bitcoin plunges 42% from peak as stocks surge to new highs, breaking their long-standing correlation.
- A $19B leverage wipeout killed Bitcoin’s momentum, and it hasn’t recovered since.
- Bitcoin is no longer a “high-beta Nasdaq trade,” it’s now moving on its own cycle.
The future of crypto remains largely unknown, even as the Nasdaq wraps its best 11-day run in history today. The Magnificent 7 ETF has surged 18% since March 30, 2026, while Bitcoin sits 42% below its peak.
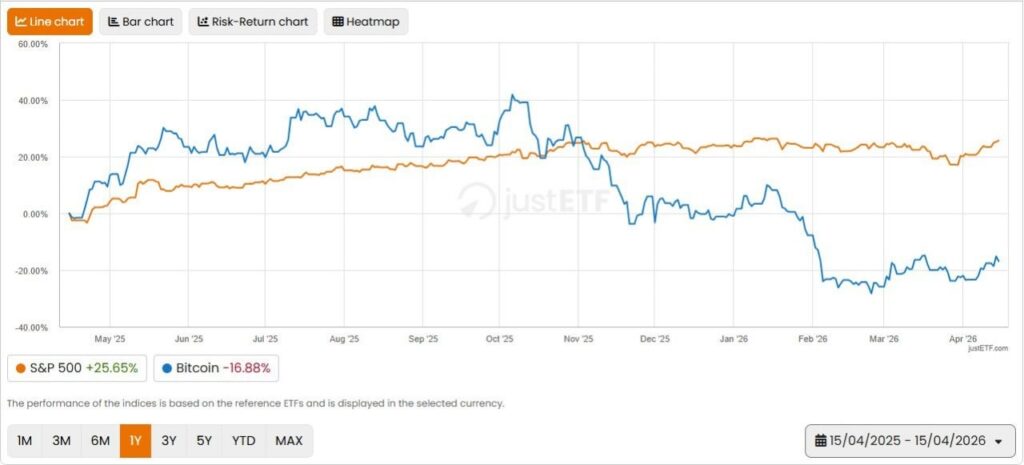
Looking at the justETF line chart covering May 2025 to mid-April 2026. The orange line representing the S&P 500 climbed a steady +25.65%. The blue line denoting Bitcoin shot above 40% in the summer of 2025, but then cratered. It has stayed in the red ever since, closing the period at –16.88%.
Stocks kept grinding higher due to potential Iran peace talks, AI earnings, and an 11-day Nvidia win streak. However, Bitcoin did not.
For most of 2025, Bitcoin traded like a high-beta version of the S&P 500. Stocks ripped, BTC ripped harder. Stocks dumped, BTC dumped harder. Nevertheless, that playbook died on October 10 and 11, 2025.
Traders liquidated $19 billion in leveraged positions in two days. Seventy thousand BTC worth of open interest vanished as the total open interest collapsed from $45 billion to $21.9 billion and never recovered. The leverage machine that powered every Bitcoin rally for two years got unwound, and nobody rebuilt it.
The 30-day correlation with the S&P 500 flipped negative in November 2025, and since then, stocks and Bitcoin have lived in different universes. The S&P 500 has pushed higher without the Mag 7 names, still posting an 8% gain, but Bitcoin has not.
Bitcoin now sits exactly mid-cycle after the April 2024 halving. The next halving lands in March 2028, and in every prior cycle, the mid-cycle drawdown wiped out weak hands. Post-halving tops usually landed 12 to 18 months after the event, while drawdown bottoms hit 24 to 30 months later. Recovery and the next all-time high came 30 to 36 months out. In this regard, the template has not changed.
Nevertheless, Bitcoin is no longer “digital Nasdaq.” It has become its own asset with its own mechanics, and that is bad news if you wanted an easy beta trade. It is good news if you understand what Bitcoin actually is.
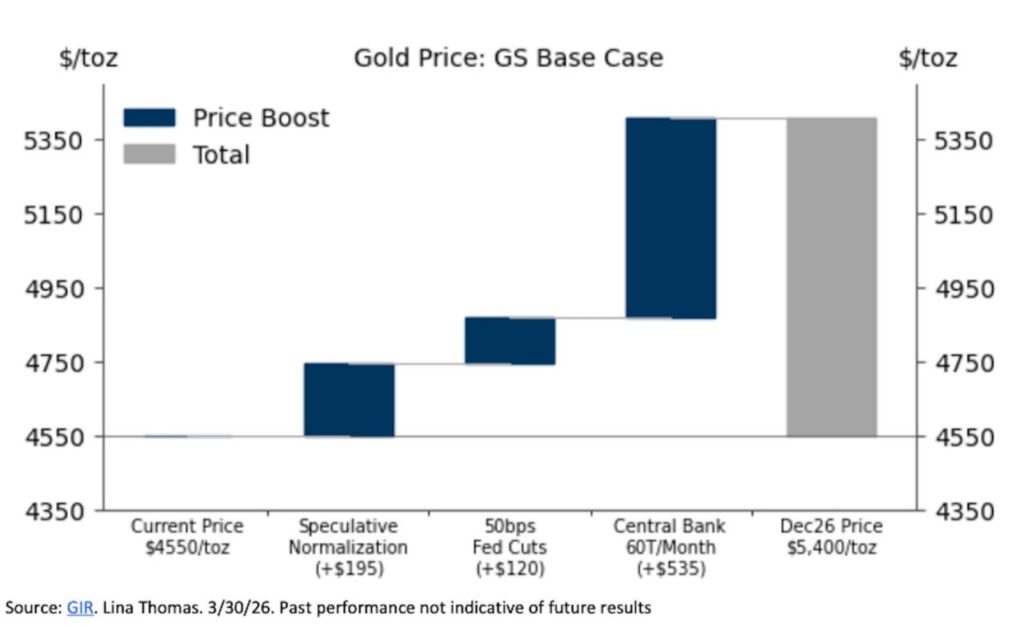
Goldman Sachs’ Roadmap for Gold to Hit $5,400 by End of 2026
Meanwhile, Goldman Sachs laid out a clear path for gold to reach $5,400 an ounce by the end of 2026. The bank sees speculative normalization adding $195, 50-basis-point Fed cuts adding $120, and central-bank diversification pouring in another $535.
The only real downside risk they flagged is “further liquidation should Hormuz disruptions persist and equities correct further.”
The chart does not lie. History says that when the drawdown ends soon, the recovery begins, and the next leg higher will start when the cycle demands it, not because of headlines today. The old leverage and correlation are gone, and the once-easy-trade narrative is no more. Bitcoin is running on its own clock now.
The post Bitcoin Tanks 42% From Peak While S&P 500 Hits New All-Time High – What the Chart Just Revealed appeared first on Blockzeit.


You May Also Like

Alleged Huione Money Laundering Boss Extradited to China

iFlux Global Collaborates With Rocket-IDO To Accelerate DeFi Adoption Through Web3 Community Launchpad


