Here’s the Silver Price If Gold Hits $7,000
Gold at $7,000 sounds like a wild prediction. However, the argument for a sharp rise in gold prices has been gaining traction in the shadows all this time. The central banks are buying in huge volumes, governments keep printing more currency, and the political uncertainty keeps mounting.
Various financial institutions and macroeconomic analysts have been consistently upgrading their forecasts. Put all of that together, and $7,000 gold stops sounding random. It starts looking like the upper end of a trend already in motion. The question for silver traders is simple. If gold hits $7,000, where does the silver price go?
A Falling Ratio Means Silver Outperforms
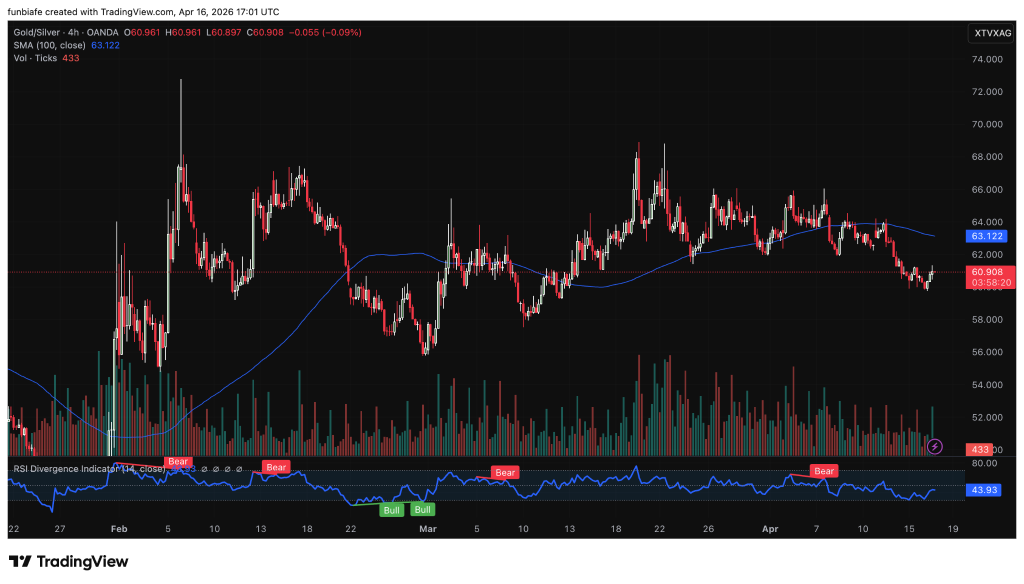
We had a look at the Gold/Silver chart. The ratio is currently trading at 60.908, down 0.09% on the session. The 100 period SMA sits above at 63.122, which means the ratio is trading below its longer term average.
 Source: TradingView
That is a bullish signal for silver. When the Gold/Silver ratio falls, silver outperforms gold. The ratio has room to drop further toward the 58.000 to 56.000 zone, which would be even better for silver.
The RSI on the 4-hour chart is at 43.93, neutral to slightly bearish. The divergence indicator shows a bearish setup on the last leg higher, which means momentum in the ratio is slowing. That typically precedes a drop in the ratio, which again favors silver over gold.
Why Gold at $7,000 Is Even Being Discussed
This is not just a random number being thrown around. The case for much higher gold prices has been building in the background. Central banks are buying gold like never before, especially outside the West. That is not speculative demand. That is strategic positioning.
Governments keep expanding the money supply and running deficits, and gold is one of the few assets that cannot be printed. Geopolitical risks keep piling up, and every new headline pushes more capital toward safe havens.
Major banks and macro analysts have been steadily raising their targets. Some say $3,000. Others say $5,000. A few are now pushing scenarios toward $7,000 under extreme conditions.
These are not retail voices. These are institutions looking at macro trends over years, not weeks. Put all of that together, and $7,000 gold stops sounding wild. It starts looking like the upper end of a trend that is already in motion.
Read Also: Where Is Silver Price Headed Next? Another Short Squeeze Brewing as Demand Outpaces Supply by 50M Oz
Where the Silver Price Goes From Here
The 4-hour chart shows the Gold/Silver ratio below its 100 period SMA and losing momentum. That is a bullish setup for silver. The ratio has support at 58.000, 56.000, and 54.000. Each drop in the ratio pushes the silver price higher for any given gold price.
The silver price today is near $75. If gold hits $7,000, a realistic range for the silver price is $115 to $175 per ounce, depending on how much the ratio compresses. In a super bull case with the ratio dropping to 30, the silver price could hit $233.
The macro case for $7,000 gold is not crazy. The central bank buying, the money printing, the geopolitical risk. It is all there. Silver is waiting for the ratio to do its part. The chart says the ratio is starting to roll over.
Subscribe to our YouTube channel for daily crypto updates, market insights, and expert analysis.
The post Here’s the Silver Price If Gold Hits $7,000 appeared first on CaptainAltcoin.


You May Also Like
Thomas' 'historically illiterate' speech gets history 'wildly inaccurate': scholar

US Dollar Index Forecast: Critical Battle Below 98.50 as Nine-Day EMA Caps Rally