

Bitcoin Correlation to Nasdaq Breaks Down as BTC Price Signals Potential Shift
TLDR:
- Bitcoin correlation with Nasdaq has dropped to -0.20, marking a rare decoupling phase in 2026
- Correlation ranged 0.40–0.70 in 2021-2022, then peaked 0.85 during late 2022 volatility periods
- Van de Poppe notes Bitcoin averages +45% in 3 months and +370% in 12 months post-correction
- BTC trades near $74.8K with $42B volume, showing mixed momentum but steady participation levels
Bitcoin’s correlation with the Nasdaq has shifted sharply into negative territory, according to recent market commentary from Michaël van de Poppe.
The change marks one of the weakest alignment phases between the two assets in a decade-long dataset. Historical readings show a transition from strong positive linkage to outright divergence in recent quarters.
Bitcoin now trades near $74,819 as equity relationships weaken and market structure adjusts.
Data shared by Michaël van de Poppe indicates the Bitcoin-Nasdaq correlation ranged between 0.40 and 0.70 during 2021 to 2022, climbed to 0.75 to 0.85 in late 2022, and has recently fallen to around -0.20 in late 2025 and early 2026.
This divergence has raised attention on whether equities will lead crypto markets or vice versa in the current cycle.
Bitcoin Correlation and Nasdaq Breakdown Across Equity Cycles
Market data shows a notable breakdown in the historical relationship between Bitcoin and the Nasdaq in recent months.
This divergence marks a shift from tightly coupled behavior seen in prior macro cycles. This shift follows years of evolving correlation structures between traditional and digital markets.
Between 2021 and 2022, both assets moved in stronger alignment, with correlation holding between 0.40 and 0.70.
Risk-on sentiment drove synchronized trading patterns across crypto and equities. Institutional inflows and macro liquidity conditions reinforced parallel movement during this period.
That alignment intensified in late 2022, when correlation readings climbed into the 0.75 to 0.85 range during high-volatility conditions.
Macro tightening conditions contributed to synchronized sell-offs across both markets. Both assets reacted similarly to aggressive rate expectations and liquidity tightening phases.
In 2025 and early 2026, the relationship weakened significantly, coinciding with the ETF era and shifting liquidity flows, pushing correlation to around -0.20.
Market participants now track whether this decoupling persists. ETF-related flows introduced new dynamics that altered traditional correlation behavior across cycles
Bitcoin Price Action and Post-Correction Market Signals
Bitcoin continues to trade near $74,819, reflecting a slight 24-hour decline and a nearly 4% weekly increase, according to CoinGecko.
Price action remains within a tight short-term consolidation range. Short-term volatility remains influenced by macroeconomic uncertainty and trading activity.
Daily trading volume remains above $42 billion, signaling sustained participation despite mixed short-term momentum. Liquidity conditions remain elevated across major exchanges. Exchange order books show steady depth despite intraday fluctuations.
Historical patterns highlighted by van de Poppe suggest Bitcoin has averaged a 45% gain within three months following sharp corrections.
These patterns reflect recurring post-drawdown recoveries. Besides, these trends often emerge after significant market dislocations in previous cycles.
Longer-term data indicates average returns of up to 370% within twelve months after similar market drawdowns, based on historical cycles. These figures derive from past volatility regimes.
However, outcomes vary depending on macro liquidity and investor positioning.
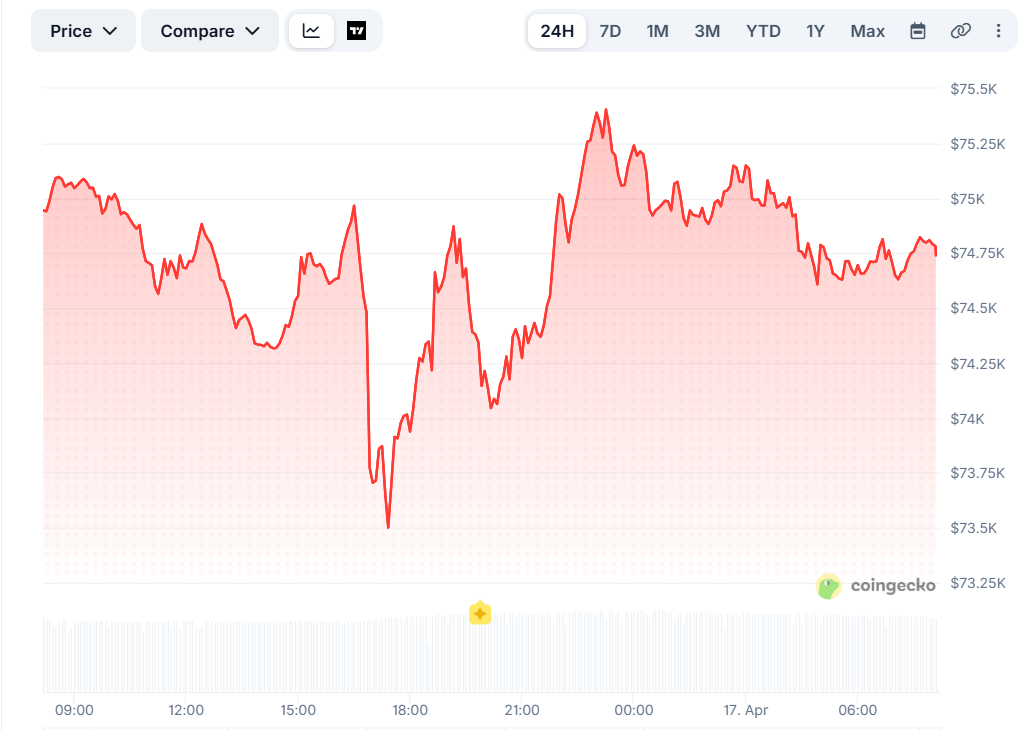 BTC Price on CoinGecko
The post Bitcoin Correlation to Nasdaq Breaks Down as BTC Price Signals Potential Shift appeared first on Blockonomi.


You May Also Like

BTC Price Shaky Near $67K While Oil Surges on Middle East Tensions: What's Next? (April 2 Update)

US Shifts Seized Bitfinex Hack Bitcoin Worth $606K to Coinbase Prime


