

Bitcoin (BTC) Rejected At $78,000 Again; Top Analyst Says a Bigger Drop Could Follow
Bitcoin pushed back into the $78,000 zone this week, but the move did not last long. Price tested a key resistance area between $78,000 and $80,000 and quickly lost strength, closing near $77,000. That reaction lines up closely with what Crypto Patel pointed out earlier, and the chart now shows why this level matters so much.
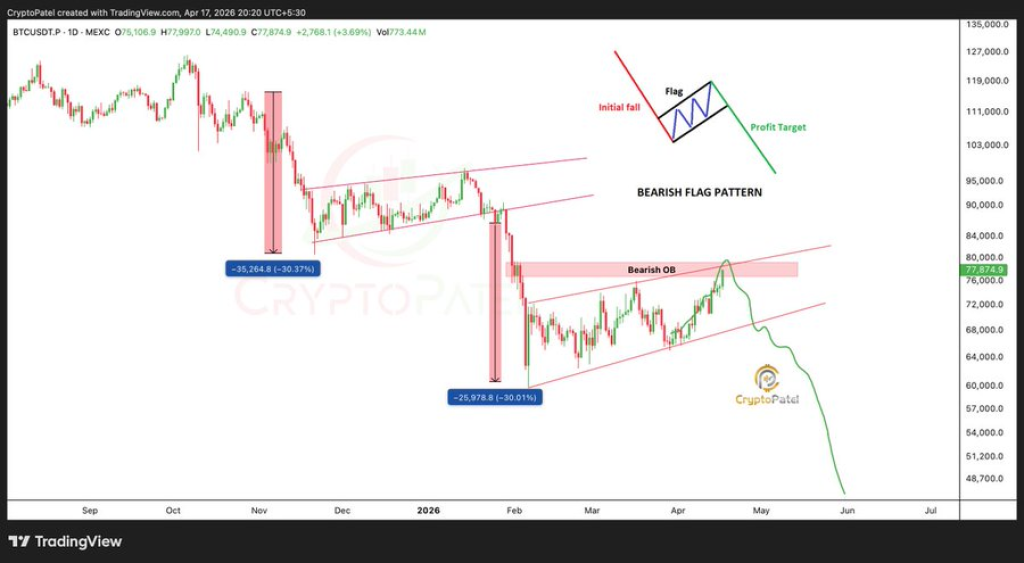
A closer look at the chart shows Bitcoin moving inside a rising channel after a sharp drop earlier in the year. That structure often forms a bearish flag, which usually appears before another move lower if resistance holds.
Crypto Patel highlighted the same idea when Bitcoin reclaimed $78,000. His focus stayed on the bearish order block between $78,000 and $80,000. Price entered that zone, failed to break through, and turned lower. That rejection now confirms sellers are still active in that region.
The earlier drop of around 30% created the base for this pattern. Price then moved upward in a controlled channel, which does not show strong bullish pressure. That type of recovery usually lacks conviction, and resistance zones tend to hold more easily.
 @CryptoPatel / X
Crypto Patel Scenario Shows $68,000 As Key Downside Target
Crypto Patel outlined two clear paths for Bitcoin, and the first one now looks more relevant after the rejection.
The bearish case points to a move toward $68,000 if resistance continues to hold. The chart supports this idea with a projected breakdown from the flag structure. A measured move from the pattern aligns closely with that $68,000 region.
Another factor comes from the repeated failure near the same resistance band. Each rejection weakens bullish momentum and increases the chance of a deeper pullback.
Read Also: Crypto Price Predictions For Today, April 18: SUI, XRP, Ethena (ENA)
The alternative scenario still exists. A clean break above $80,000 could open the door toward $88,000 to $90,000, which marks another major resistance zone. That move would require strong buying pressure and a daily close above resistance. Current price action does not show that strength yet.
Bearish Flag Structure Suggests Bitcoin Could Extend Losses
The broader structure tells a consistent story. Bitcoin formed an initial sharp drop, followed by a rising channel that looks corrective. This pattern often leads to continuation in the original direction.
The projected path on the chart shows a gradual move lower that accelerates after support breaks. That path lines up with previous support zones near $68,000 and even lower levels if selling pressure increases.
Market structure also shows lower highs forming near resistance, which keeps the trend under pressure. Bulls need to reclaim $80,000 and hold above it to change this structure in a meaningful way.
Read Also: RaveDAO (RAVE) Red Flags: Team Bids Its Own Token, Nukes Shorts, Then Will Pull The Rug
Bitcoin now sits at a critical level after failing to hold above $78,000. The rejection confirms the importance of the $78,000 to $80,000 zone, and Crypto Patel’s analysis remains in play.
The next few sessions could decide the direction. Continued weakness may push BTC price toward $68,000 as the bearish flag plays out. A strong reversal above $80,000 would challenge that outlook and shift focus toward higher resistance.
Subscribe to our YouTube channel for daily crypto updates, market insights, and expert analysis.
The post Bitcoin (BTC) Rejected At $78,000 Again; Top Analyst Says a Bigger Drop Could Follow appeared first on CaptainAltcoin.


You May Also Like

Bittensor Price Prediction: Where Could TAO Price Go If It Becomes the “AWS of Decentralized AI”?

U.S. Army Pairs Drone With Bunker Buster Bomb In First Use


