

Tether Weekly Technical Analysis: Stability, Liquidity Flows, and Market Signals
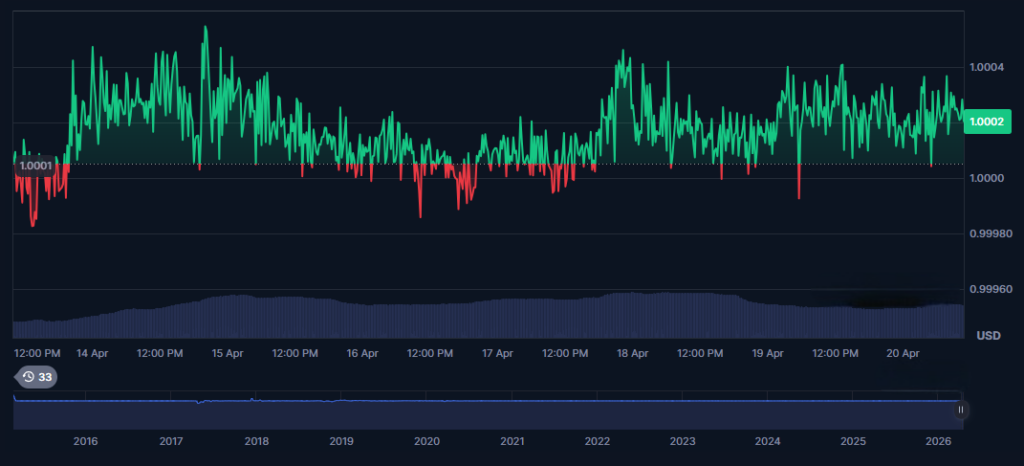
Tether (USDT) continues to demonstrate exceptional price stability on the weekly timeframe, trading tightly around its $1.00 peg. The latest chart shows minimal deviation, with price fluctuating between approximately $0.9996 and $1.0004. While this may appear uneventful compared to volatile cryptocurrencies, USDT’s micro-movements provide critical insights into market liquidity, capital flows, and overall crypto sentiment.
Price Structure and Stability Dynamics
Unlike traditional crypto assets, USDT does not follow trending patterns. Instead, it operates within a mean-reverting structure, consistently returning to its $1 peg. The recent weekly chart reflects this behavior, with repeated short-lived spikes above and below $1.000.
These fluctuations are not random—they are driven by arbitrage mechanisms. When USDT trades above $1, traders sell to capture profits, pushing the price down. When it dips below $1, buyers step in, restoring equilibrium. This continuous balancing act is what maintains USDT’s stability.
Technically, the tight range compression indicates a highly efficient market. The absence of sustained deviations suggests strong liquidity and confidence in the peg.
Key Support and Resistance Zones
Even stablecoins exhibit technical levels, though they are far narrower than volatile assets.
- Immediate Support: $0.9996
- Strong Support: $0.9990
- Immediate Resistance: $1.0004
- Upper Resistance: $1.0010
These levels represent operational boundaries rather than speculative zones. A break below $0.9990 or above $1.0010 would signal unusual stress or imbalance in the market.
Volume and Liquidity Signals
Volume plays a crucial role in understanding USDT’s behavior. The chart shows relatively steady volume, with slight increases during minor price deviations.
This indicates that:
- Arbitrage activity rises during price imbalances
- Liquidity remains deep and responsive
- Market participants actively maintain the peg
Periods of increased volume often coincide with market-wide volatility, as traders move funds between stablecoins and cryptocurrencies.
Market Dominance and Capital Flows
USDT remains the dominant stablecoin, controlling nearly 58% of the market with over $185 billion in capitalization . This dominance makes it a key indicator of market sentiment.
- Rising USDT dominance: Signals risk-off behavior (capital moving to safety)
- Falling dominance: Indicates capital flowing into risk assets like altcoins
Recent data shows a slight decline in dominance, suggesting that capital is gradually rotating into the broader crypto market.
This aligns with improving sentiment across altcoins and increased trading activity.
Macro and Fundamental Drivers
Stablecoin Market Expansion
The stablecoin market has surpassed $320 billion, reflecting growing adoption and liquidity inflows. This expansion strengthens USDT’s role as a core liquidity provider in crypto markets.
Institutional and Regulatory Developments
Recent global discussions highlight the increasing importance of stablecoins:
- Global regulators stress the need for coordinated stablecoin oversight to prevent systemic risks
- Europe is pushing for euro-based alternatives to reduce reliance on USDT
- Tether continues to expand despite regulatory scrutiny and market competition
These developments show that USDT is not just a trading tool—it is becoming part of the broader financial system.
Treasury and Financial Market Impact
Stablecoins like USDT are increasingly influencing traditional finance. Research shows that stablecoin issuers hold significant amounts of U.S. Treasury bills, positioning them as major players in global liquidity markets.
This connection reinforces USDT’s role as a bridge between crypto and traditional finance.
Technical-Macro Relationship
USDT is often used as a leading indicator for crypto market movements.
- Increased USDT supply (minting) often precedes bullish moves in Bitcoin
- Reduced supply or increased demand for USDT signals defensive positioning
Academic studies confirm that stablecoin demand shocks can influence broader financial markets, including interest rates and asset prices.
This makes USDT a critical tool for analyzing market cycles.
Bullish Scenario (Market Context)
For USDT, a “bullish” scenario does not mean price increase but increased adoption and liquidity dominance.
- Continued growth in stablecoin market size
- Increased use in global payments and DeFi
- Strong arbitrage mechanisms maintaining the peg
In this scenario, USDT strengthens its position as the primary liquidity layer in crypto.
Bearish Risks and Stress Signals
Despite its stability, USDT faces several risks:
- Regulatory pressure: Governments may impose stricter controls
- Transparency concerns: Ongoing debates about reserve composition
- Competition: Rivals like USDC gaining market share
- Systemic risk: A loss of confidence could trigger temporary depegging
Historical assessments have also raised concerns about reserve quality, even though USDT has maintained its peg during market stress.
Final Outlook
Tether’s weekly technical structure highlights a unique asset where stability itself is the signal. The tight trading range around $1 reflects strong liquidity, efficient arbitrage, and continued market confidence.
However, the real value of USDT analysis lies beyond price. Its dominance trends, volume patterns, and macro connections provide crucial insights into crypto market direction, risk sentiment, and capital flows.
As the stablecoin market continues to expand and integrate with global finance, USDT will remain a central pillar of the digital asset ecosystem. For traders and investors, monitoring USDT is less about price movement—and more about understanding the heartbeat of the crypto market itself.


You May Also Like

Why The Green Bay Packers Must Take The Cleveland Browns Seriously — As Hard As That Might Be

Peter Schiff Warns MicroStrategy May Be Forced to Sell Bitcoin to Save Stock

Nvidia (NVDA) Stock Holds $200 Despite Analyst Targets Above $305


