

Ethereum (ETH) Price: Is this Dip a Warning Sign or a Buying Opportunity?
TLDR
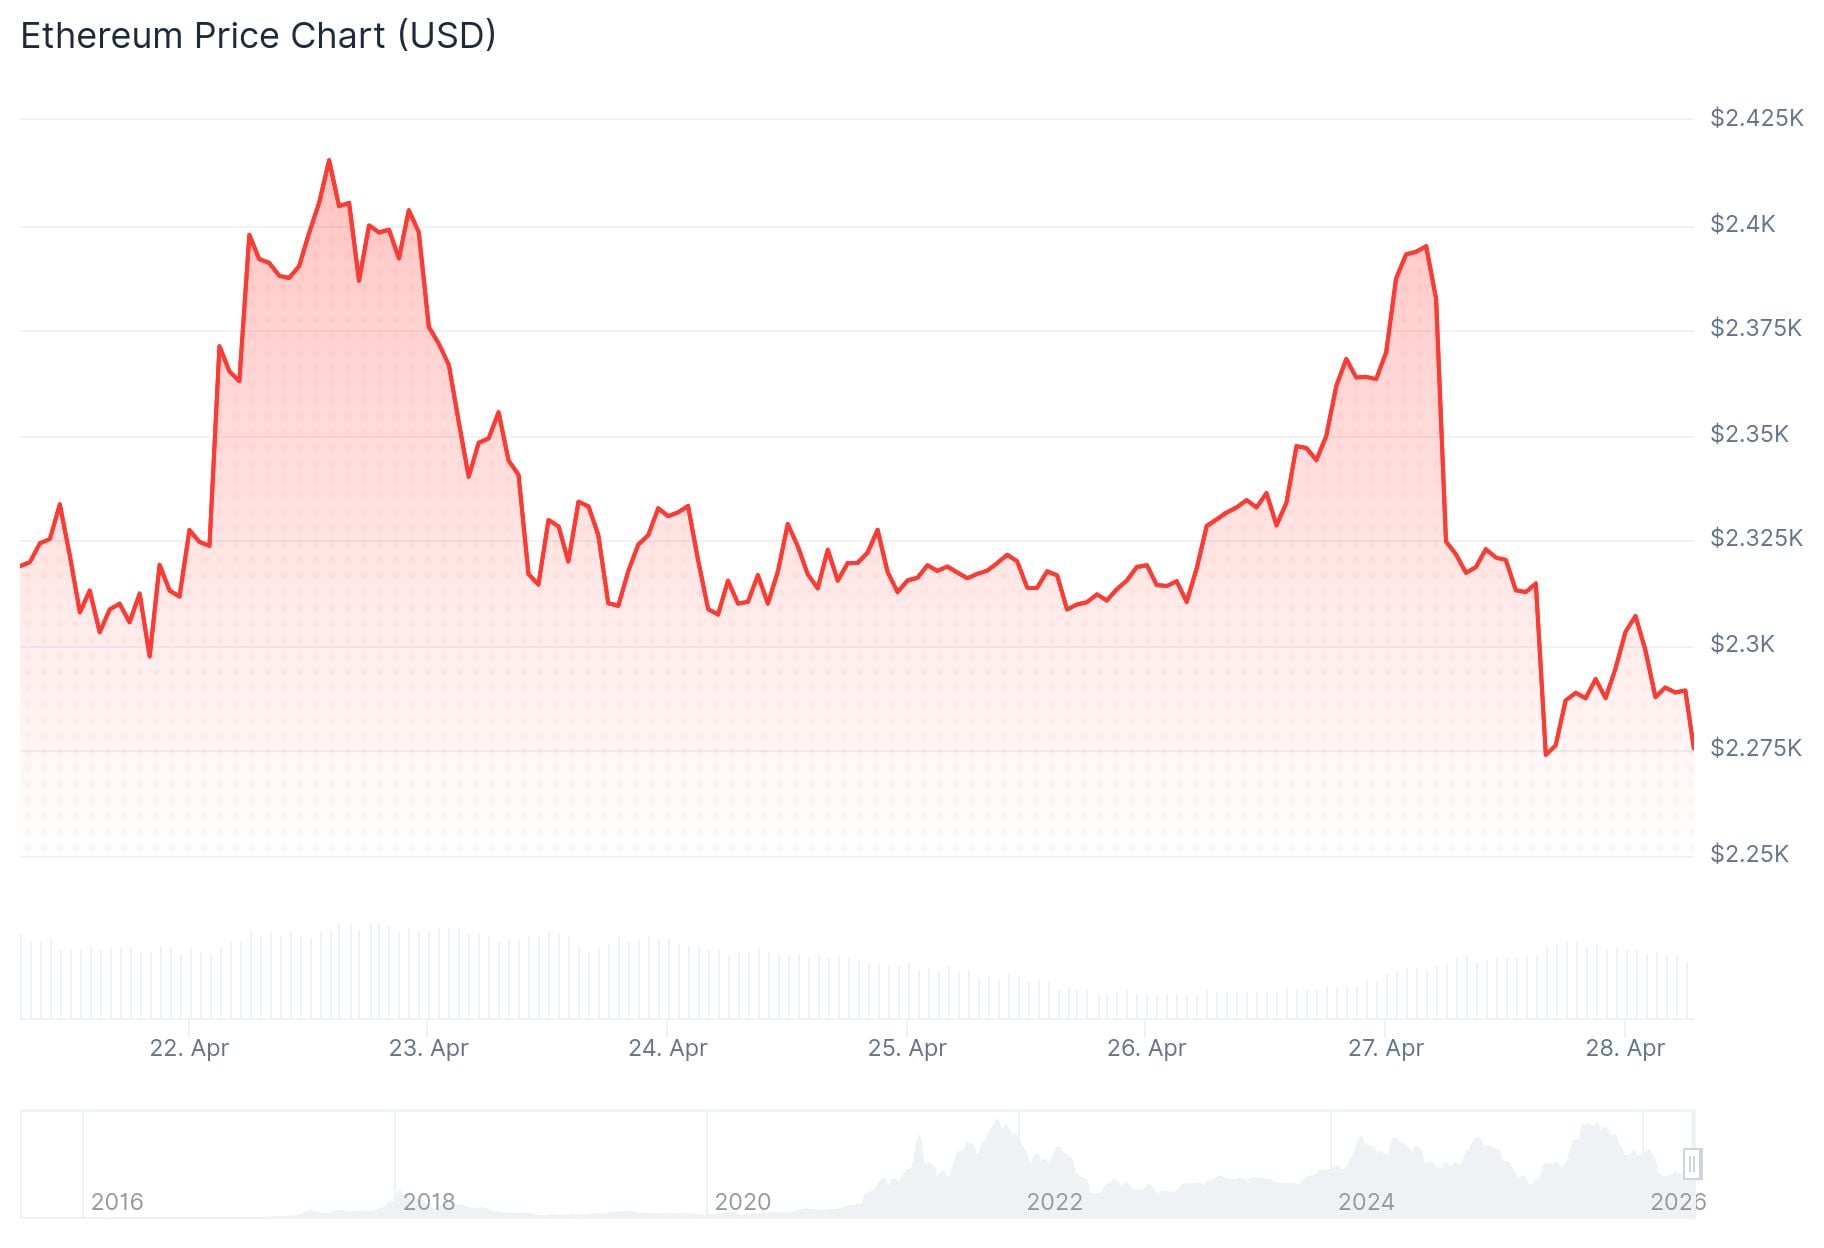
- ETH fell 3.4% to $2,287 after its fourth rejection at the $2,400 resistance level
- A triple top pattern has formed on the daily chart, with $2,150 now a key support zone
- Over $2.5 billion in leveraged longs sit below $2,150, raising forced liquidation risk
- The ETH/BTC ratio dropped below 0.032, signaling weakness relative to Bitcoin
- Long-term charts show ETH in an accumulation zone, but no confirmed breakout yet
Ethereum has failed to break above $2,400 four times since April 14, forming a triple top pattern on the daily chart. On Monday, ETH dropped 3.4% to $2,287, continuing a stretch of rejected upside attempts.
 Ethereum (ETH) Price
The 100-day exponential moving average near $2,350 has acted as dynamic resistance throughout this period. Price has not closed above it on the daily chart, keeping rallies short.
Crypto analyst Michaël van de Poppe of MN Capital flagged weakness in the ETH/BTC pair. The ratio fell below 0.032 BTC, breaking a support level that had previously underpinned continuation attempts. The ratio also slipped under its 21-period moving average, pointing to fading strength against Bitcoin.
The next higher timeframe support for the ETH/BTC pair sits near 0.026 BTC, where buyers had previously stepped in.
$2,150 Support Zone in Focus
The $2,150 level is now the main area to watch. It previously acted as resistance and has since flipped to support. A break below it would expose the $2,050 to $1,900 range.
Liquidation data from CoinGlass shows over $2.5 billion in leveraged long positions sitting just below $2,150. A move through that level could trigger forced selling.
On Binance, Ether’s open interest has fallen to $2.58 billion, matching levels from when ETH was trading near $2,200 earlier this month. The funding rate is near -0.013%, its lowest reading since February, with short positions now dominating new activity.
Analyst Amr Taha noted this setup — lower leverage, shorts-heavy positioning — could lead to a price squeeze if ETH holds near current levels.
Long-Term Charts Suggest Accumulation Phase
Crypto Patel shared a two-week chart on X showing Ethereum trading near the lower end of a long-term rising channel. The $1,700 to $2,250 range is labeled as a liquidity grab and accumulation zone, a level that has held as broad support since 2022.
The first resistance above current price sits near $2,480, followed by the $3,500 to $4,900 band, which includes the previous all-time high area near $4,876.
A separate three-day chart shared by James Easton on X shows a repeated pattern where major rallies followed deep pullbacks. A white dot marks the current 2026 low, suggesting ETH may be forming another base.
Both charts stop short of confirming a new rally. ETH would need to hold the accumulation zone and reclaim $2,480 before any bullish case strengthens.
The key level remains $2,150, where technical support and liquidation risk meet on the daily chart.
The post Ethereum (ETH) Price: Is this Dip a Warning Sign or a Buying Opportunity? appeared first on CoinCentral.


You May Also Like

How to earn from cloud mining: IeByte’s upgraded auto-cloud mining platform unlocks genuine passive earnings

ICBA Opposes OCC’s Conditional Nod For Coinbase National Trust Bank Charter


