ONDO vs. Bittensor (TAO): Which Is Better to Hold for the Next 6 Months?
Ondo Finance and Bittensor have both drawn attention in 2026, but they are attracting capital for very different reasons. The ONDO price and TAO price moved through sharp corrections in early Q2, and both have started to recover; but which is better to hold till the end of 2026?
Ondo Finance focuses on bringing traditional financial products onchain, especially yield backed by treasury-style assets. Bittensor focuses on building a decentralized network where artificial intelligence models compete and get rewarded for useful outputs. Both sit in infrastructure narratives, yet their paths forward depend on completely different drivers.
Ondo operates closer to regulated finance, with structured products and permissioned access playing a key role. Bittensor stays fully crypto native and permissionless, with incentives tied to network contribution. ONDO connects to the expansion of tokenized real-world assets. TAO connects to demand for decentralized AI and machine intelligence.
That difference shapes the risk and upside profile of each asset.
ONDO Price And TAO Price Movement In 2026 Shows Two Different Market Forces
ONDO price reached a yearly high of $0.47098 in early January before dropping to $0.2426 in mid April. Price has since recovered to around $0.3165. That move reflects renewed attention on tokenized equities and Ondo Finance holding a dominant share in that segment.
The TAO price followed a separate pattern. It traded above $335 in early April before correcting toward $239. Price has now recovered to about $284.68, which shows a strong bounce within a short period. The move connects closely to network expansion and increasing capacity across subnets.
Both assets declined during early Q2 and recovered into May. That similarity can be misleading but it is betteer to understand that ONDO reacts more to developments in financial products and institutional use cases. TAO reacts more to growth in AI demand and network activity.
ONDO Price Analysis Shows Strong Momentum But Limited Immediate Upside
ONDO price trades near $0.32 and sits above its short-term averages. The 7-day SMA remains around $0.28, and the 30-day SMA stays near $0.26. That confirms strong short term trend strength.
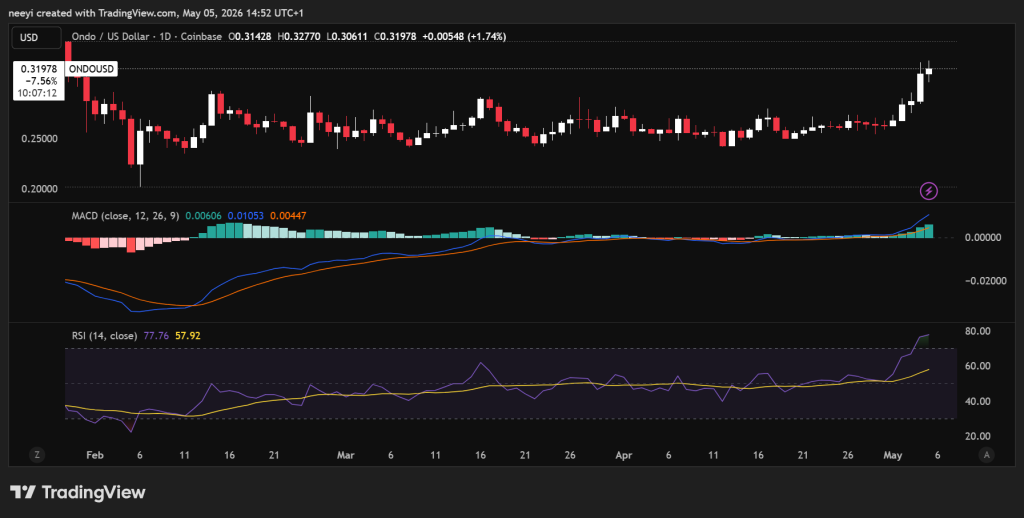 ONDO Price Chart from TradingView.com
Long term structure still needs confirmation. The 200-day SMA sits around $0.39, and ONDO remains below that level. This places the asset in a recovery phase instead of a fully established uptrend.
Momentum indicators show stretched conditions. RSI(14) sits near 77, and RSI(7) reaches close to 91. Those levels often lead to consolidation phases. MACD remains positive, which shows that upward pressure still exists.
Fibonacci mapping from the recent swing places the 200% extension near $0.41. That represents roughly a 1.27x move from current levels.
| Metric | Value |
|---|---|
| Price | $0.32 |
| 7 Day SMA | $0.28 |
| 30 Day SMA | $0.26 |
| 200 Day SMA | $0.39 |
| RSI (14) | 77 |
| RSI (7) | 91 |
| MACD | Positive |
The structure suggests that ONDO may continue higher, but the current move already looks stretched. Short-term pullbacks or sideways movement could appear before any sustained breakout.
TAO Price Structure Shows Stronger Trend And More Room For Growth
TAO price trades around $287 and sits above all major moving averages. The 7-day SMA stays near $270, the 30-day SMA sits around $266, and the 200-day SMA remains close to $272. This alignment confirms a stable uptrend across multiple timeframes.
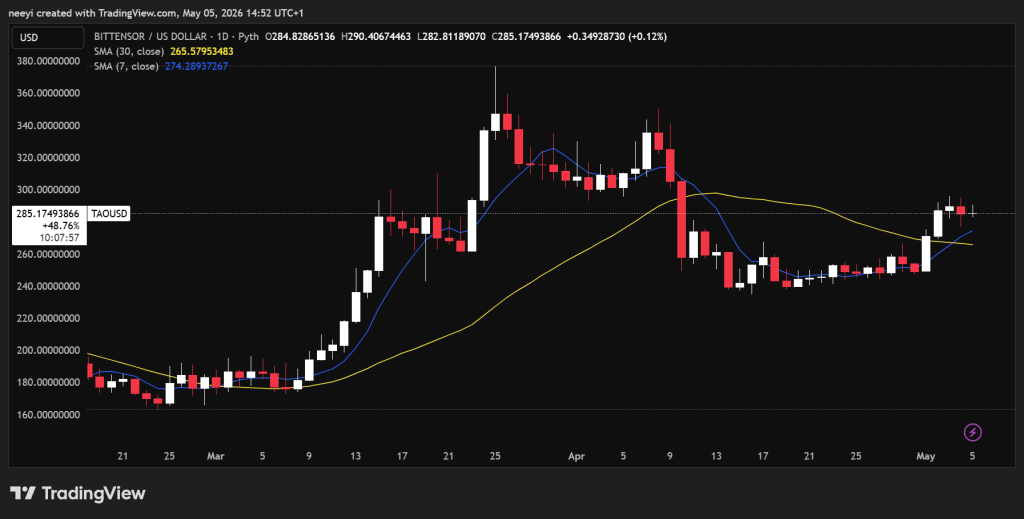 TAO Price Chart / TradingView.com
Momentum indicators support continuation. RSI(14) stays near 59, and RSI(7) remains around 69. These levels allow room for further upside without immediate exhaustion. MACD remains clearly positive, which supports the ongoing trend.
Fibonacci projections from the recent range place the 200% extension near $464. That represents roughly a 1.6x move from current price.
| Metric | Value |
|---|---|
| Price | $287 |
| 7 Day SMA | $270 |
| 30 Day SMA | $266 |
| 200 Day SMA | $272 |
| RSI (14) | 59 |
| RSI (7) | 69 |
| MACD | Positive |
The TAO structure looks healthier compared to ONDO. Trend strength remains intact, and momentum has not reached extreme levels.
ONDO Price Outlook for the Next 6 Months
Base Scenario For ONDO Price
ONDO may spend the next 6 months moving sideways between $0.25 and $0.45. This outcome fits the current structure, where price remains below the 200-day level and momentum already looks stretched.
This type of range usually appears when an asset transitions from recovery into a more stable trend. Buyers defend dips, but strong resistance limits upside until a new base forms.
Bullish Scenario For ONDO Price
A stronger move becomes possible if ONDO breaks above the $0.39 to $0.40 region and holds that level as support. That area represents the 200-day average, which acts as a key structural barrier.
A successful breakout could push price toward the Fibonacci extension near $0.41 and slightly beyond into the high $0.40 range. This scenario depends on continued growth in tokenized real-world assets and sustained institutional demand.
Even in this case, the upside remains moderate in the short term. The current structure does not yet support large multiples without new accumulation phases forming.
Bearish Scenario For ONDO Price
Overbought RSI levels often resolve through pullbacks. Price could move back toward the 30 day average and potentially into the low $0.20 range.
This scenario does not break the broader recovery structure, but it would reset momentum and delay any breakout attempt. Drawdowns of 30% or more can still occur within developing trends.
ONDO Price Outlook for the Next 6 Months
Base Scenario For TAO Price
TAO may continue trending higher in a controlled manner as long as the price holds above its key moving averages. This scenario supports a gradual move toward the $400 to $460 region over the next 6 months.
This outcome reflects a healthy trend where buyers continue to step in on pullbacks without pushing the asset into overextended conditions. The structure remains intact, and price respects rising support levels.
Bullish Scenario For TAO Price
A stronger move becomes possible if TAO builds support above previous highs and accelerates beyond the current structure. In this case, price could move past the Fibonacci projection near $464 and extend further.
This scenario depends on continued expansion within Bittensor’s network and stronger demand for decentralized AI infrastructure. If those conditions remain favorable, TAO could move well beyond the current 1.6x projection.
Bearish Scenario For TAO Price
The bullish structure weakens if TAO loses the $270 region, which aligns with the 200 day moving average. A breakdown below that level would signal a shift from trend continuation into a more neutral or corrective phase.
Price could retrace toward the mid $200 range or lower before establishing a new base. This scenario reflects a reset in momentum rather than a complete breakdown of the long term structure.
Read Also: ChatGPT Predicts Where Bitcoin and Gold Will Go If Offshore Dollar Usage Keeps Rising
Which Is Better To Hold For The Next 6 Months
The answer depends on what type of exposure an investor wants, but the current data gives a clear directional lean.
TAO looks stronger from a technical perspective. The trend remains intact, and the upside within the current structure appears larger. The TAO price also shows more balanced momentum, which reduces the risk of immediate pullbacks.
ONDO offers a different kind of opportunity. Its link to real-world assets and institutional finance provides a solid long-term narrative. Short-term charts suggest that the current move may pause before any strong continuation develops.
TAO appears better positioned for the next 6 months based on trend strength and technical structure. ONDO remains relevant for those focused on financial infrastructure and longer-term adoption themes.
FAQs
Subscribe to our YouTube channel for daily crypto updates, market insights, and expert analysis.
The post ONDO vs. Bittensor (TAO): Which Is Better to Hold for the Next 6 Months? appeared first on CaptainAltcoin.


You May Also Like
![[Rear View] The President needs to reclaim the narrative](https://www.rappler.com/tachyon/2026/06/MARCOS-YEAR-4-RECLAIM-THE-NARRATIVE-JUN-27-2026.jpg)
[Rear View] The President needs to reclaim the narrative

CME Group to launch Solana and XRP futures options in October