

XRP Eyes Breakout Toward $1.80 If Bulls Secure Close Above $1.49
XRP trades near $1.47 as bulls target a breakout above $1.49, with $1.80 emerging as the next upside level.
XRP traded near $1.47 on the daily chart as analysts watched a key breakout level at $1.49.
A daily close above the top of the short-term channel could open a move toward $1.80, while failure to hold momentum may keep XRP under pressure near recent support levels.
XRP Breakout Setup Focuses on $1.49 Close
XRP is trading close to a key technical level after a recent recovery attempt. The chart shows that the token must close above $1.49 to confirm a possible channel breakout.
Market analysts are focusing on this level because it sits near the upper end of the current range. A close above it could support a short-term move toward $1.80.
The price is also near the 1.0 Fibonacci level at $1.5272. This zone has become a short-term resistance area after XRP fell below higher retracement levels.
A break above $1.49 may improve buyer confidence, but confirmation still matters. Traders often look for daily closes instead of short price spikes.
XRP remains below several major Fibonacci zones from its previous rally. This means the broader daily structure still shows pressure from sellers.
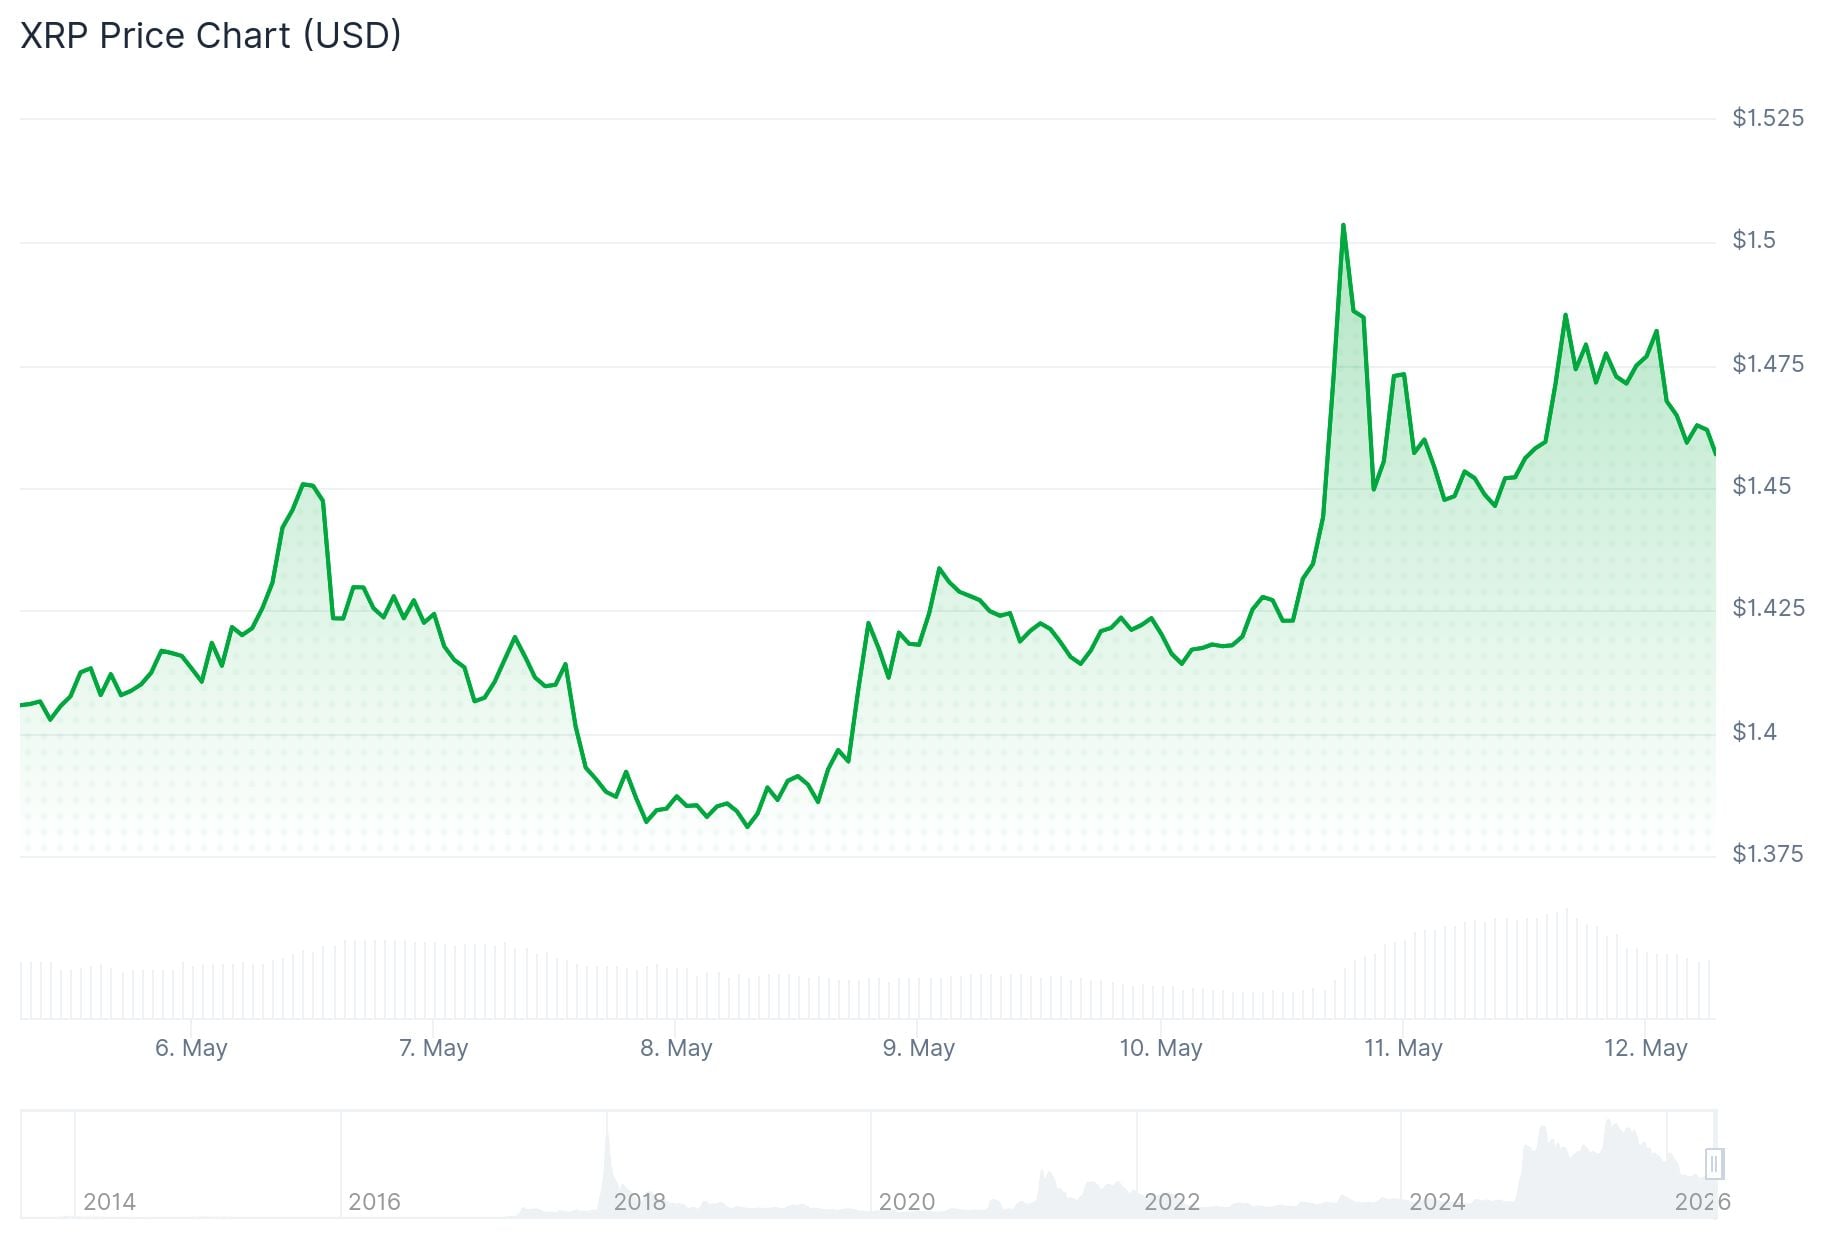
CoinGecko data shows XRP trading at $1.47, down 0.6% in the past 24 hours. The price shows mild short-term weakness, while $1.50 remains the nearest resistance for buyers.
CoinGecko also shows XRP priced at 0.00001795 BTC, down 1.3% against Bitcoin. A move above $1.50 could support recovery, while a drop below $1.45 may expose $1.40.
Fibonacci Levels Show Key Resistance Zones
The chart shows XRP pulled back from the upper range near $3.35 after a strong 2025 rally. Since that peak, the token has formed lower highs and lower lows.
XRP is currently below the 0.786 Fibonacci level at $1.9174. It also trades below the 0.618 level at $2.2237, which remains an important resistance zone.
The nearest resistance range sits between $1.52 and $1.55. A move above this zone could strengthen the breakout case.
If buyers push XRP above $1.55, the next target may sit near $1.80. That level is being watched as the first major upside objective.
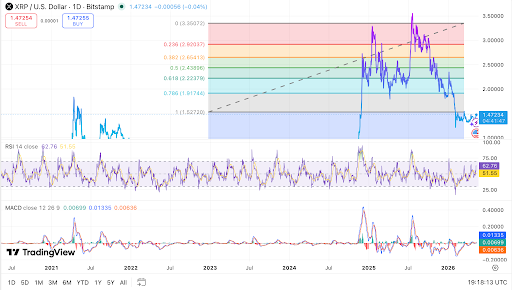 XRP tests $1.49 breakout level as momentum indicators improve. Source: TradingView.
A stronger move could later bring $1.91 into focus. This level matches the 0.786 Fibonacci retracement area on the chart.
However, failure near $1.49 or $1.52 may weaken the setup. In that case, XRP could return toward $1.35 or lower.
The next support zone is visible near $1.30 to $1.35. A deeper pullback could bring the $1.00 area back into view.
Read Also:
RSI and MACD Point to Early Momentum
The Relative Strength Index is near 62.43 on the daily chart. This shows that buying momentum has improved from recent lows.
The RSI signal line is around 51.52, which also supports a better short-term tone. However, the indicator has not moved into overbought territory.
A move above 70 would show stronger bullish pressure. Until then, the current RSI reading suggests recovery, not confirmed trend reversal.
The MACD also shows early improvement. The MACD line is near 0.01324, while the signal line is near 0.00634.
The histogram is slightly positive at around 0.00690. This shows that bullish momentum is building, but it remains modest.
XRP still needs a stronger price close to confirm the move. A daily close above $1.49 would be the first key signal.
A move through $1.52 and $1.55 would add more support to the breakout case. Until then, XRP remains near a decision zone on the daily chart.
The post XRP Eyes Breakout Toward $1.80 If Bulls Secure Close Above $1.49 appeared first on Live Bitcoin News.


You May Also Like

Google (GOOGL) Stock: Dips Marginally on Reports of India AI Infrastructure Push
XRP Price: Bullish Signals Pile Up as $2 Target Comes Back Into View


