

Bitcoin’s Volatility Regime Just Hit 1.29. Here Is What That Signals
Bitcoin’s realized volatility sits at a 4-year low at -1.29, signaling a B-wave grind. Analysts warn a sharp C-wave expansion may be closer than traders think.
Realized volatility on Bitcoin does not usually disappear this quietly. The composite z-score for BTC’s 30-day annualized realized volatility currently sits at -1.29, meaning the market is running well below its long-term historical average.
That number came from More Crypto Online on X, who posted the volatility regime chart alongside a detailed Elliott Wave breakdown. The chart, spanning data back to 2012, shows the metric has only touched this deep into negative territory a handful of times in Bitcoin’s history.
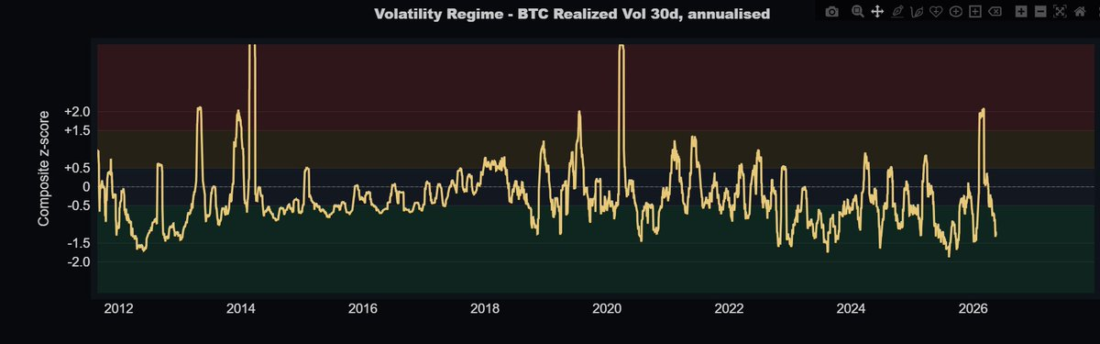
Source: More Crypto Online’s Volatility Regime chart showing BTC Realized Vol 30d
Price can still edge higher from here. That is not the debate. According to More Crypto Online on X, BTC appears to be grinding through what looks like a larger B-wave bounce. The structure keeps pushing up, but the internal energy behind it keeps fading.
B-Wave or Buildup? The Wave Count Is the Question
The daily chart shared by More Crypto Online maps out a broader corrective sequence. From the lows printed in early 2026, Bitcoin traced an A-wave up through March, then a B-wave dip, then what now looks like a C-wave advance that has been unfolding slowly through Q2. Fibonacci extension levels on the chart place key resistance at 123.60% around $86,691 and 138% near $89,630, with the 161.80% extension sitting at $94,706. The 78.60% retracement level hovers closer to $108,903.
That is the optimistic target range. Getting there requires the current structure to hold as an impulse rather than a tired grind.
The problem is the grind part. More Crypto Online on X noted that in Elliott Wave terms, environments like this one fit the behavior of a larger B-wave bounce, where price keeps inching up while momentum and volatility keep fading underneath. Not a buildup. More like an exhaust.
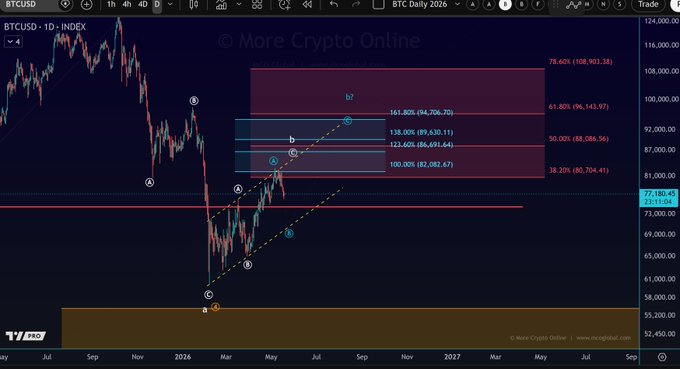
Source: More Crypto Online’s BTC Daily Elliott Wave chart showing the full wave structure
Bitcoin’s first bull signal since 2023 recently triggered on separate CryptoQuant indicators, but analysts have been careful to note that the signal itself is not a green light. That the Bull-Bear Cycle indicator flipped positive matters. What the price does with it is a different question entirely.
What Comes After the Compression
Compression phases do not hold forever. That is one of the few things in markets that tends to be consistent. The volatility regime chart from More Crypto Online shows that readings this low have historically preceded sharp expansions, in both directions.
In the current Elliott Wave read, that expansion would take the form of a C-wave move lower. The kind with rising volatility, wider candles, and momentum that actually tracks price instead of lagging behind it. More Crypto Online put it plainly on X: “Expansion eventually follows.”
What the current setup does not offer is a clear timeline. Bitcoin volatility products are now in active development at institutional levels, with CME Group planning a Bitcoin Volatility Index futures launch on June 1, pending CFTC approval. Traders preparing for a volatility expansion have more tools available now than at any prior point in the cycle.
The daily chart shows BTC sitting around $77,180 at the time of the analysis. The 100% Fibonacci extension from the base sits at $82,082, a level that, if reclaimed and held, could push the structure toward the higher Fibonacci targets. Below that, $80,704 at the 38.20% retracement acts as the first line that bulls cannot afford to lose.
The volatility z-score has been falling since the spike above +2.0 earlier in 2026. It does not usually make a clean reversal from here.
The post Bitcoin’s Volatility Regime Just Hit 1.29. Here Is What That Signals appeared first on Live Bitcoin News.


You May Also Like

Top Line plans Cebu energy complex to boost storage capacity
DC insiders predict Trump's slush fund will stoke MAGA violence in 2028


