

Onds stock volume jumps to 91.6 million as bulls eye $11.35

Onds stock extended its upswing with a close at 10.80, shifting the daily bias from neutral to cautiously bullish. Policy headlines and an imminent shareholder meeting have energized the tape, but volatility remains elevated.
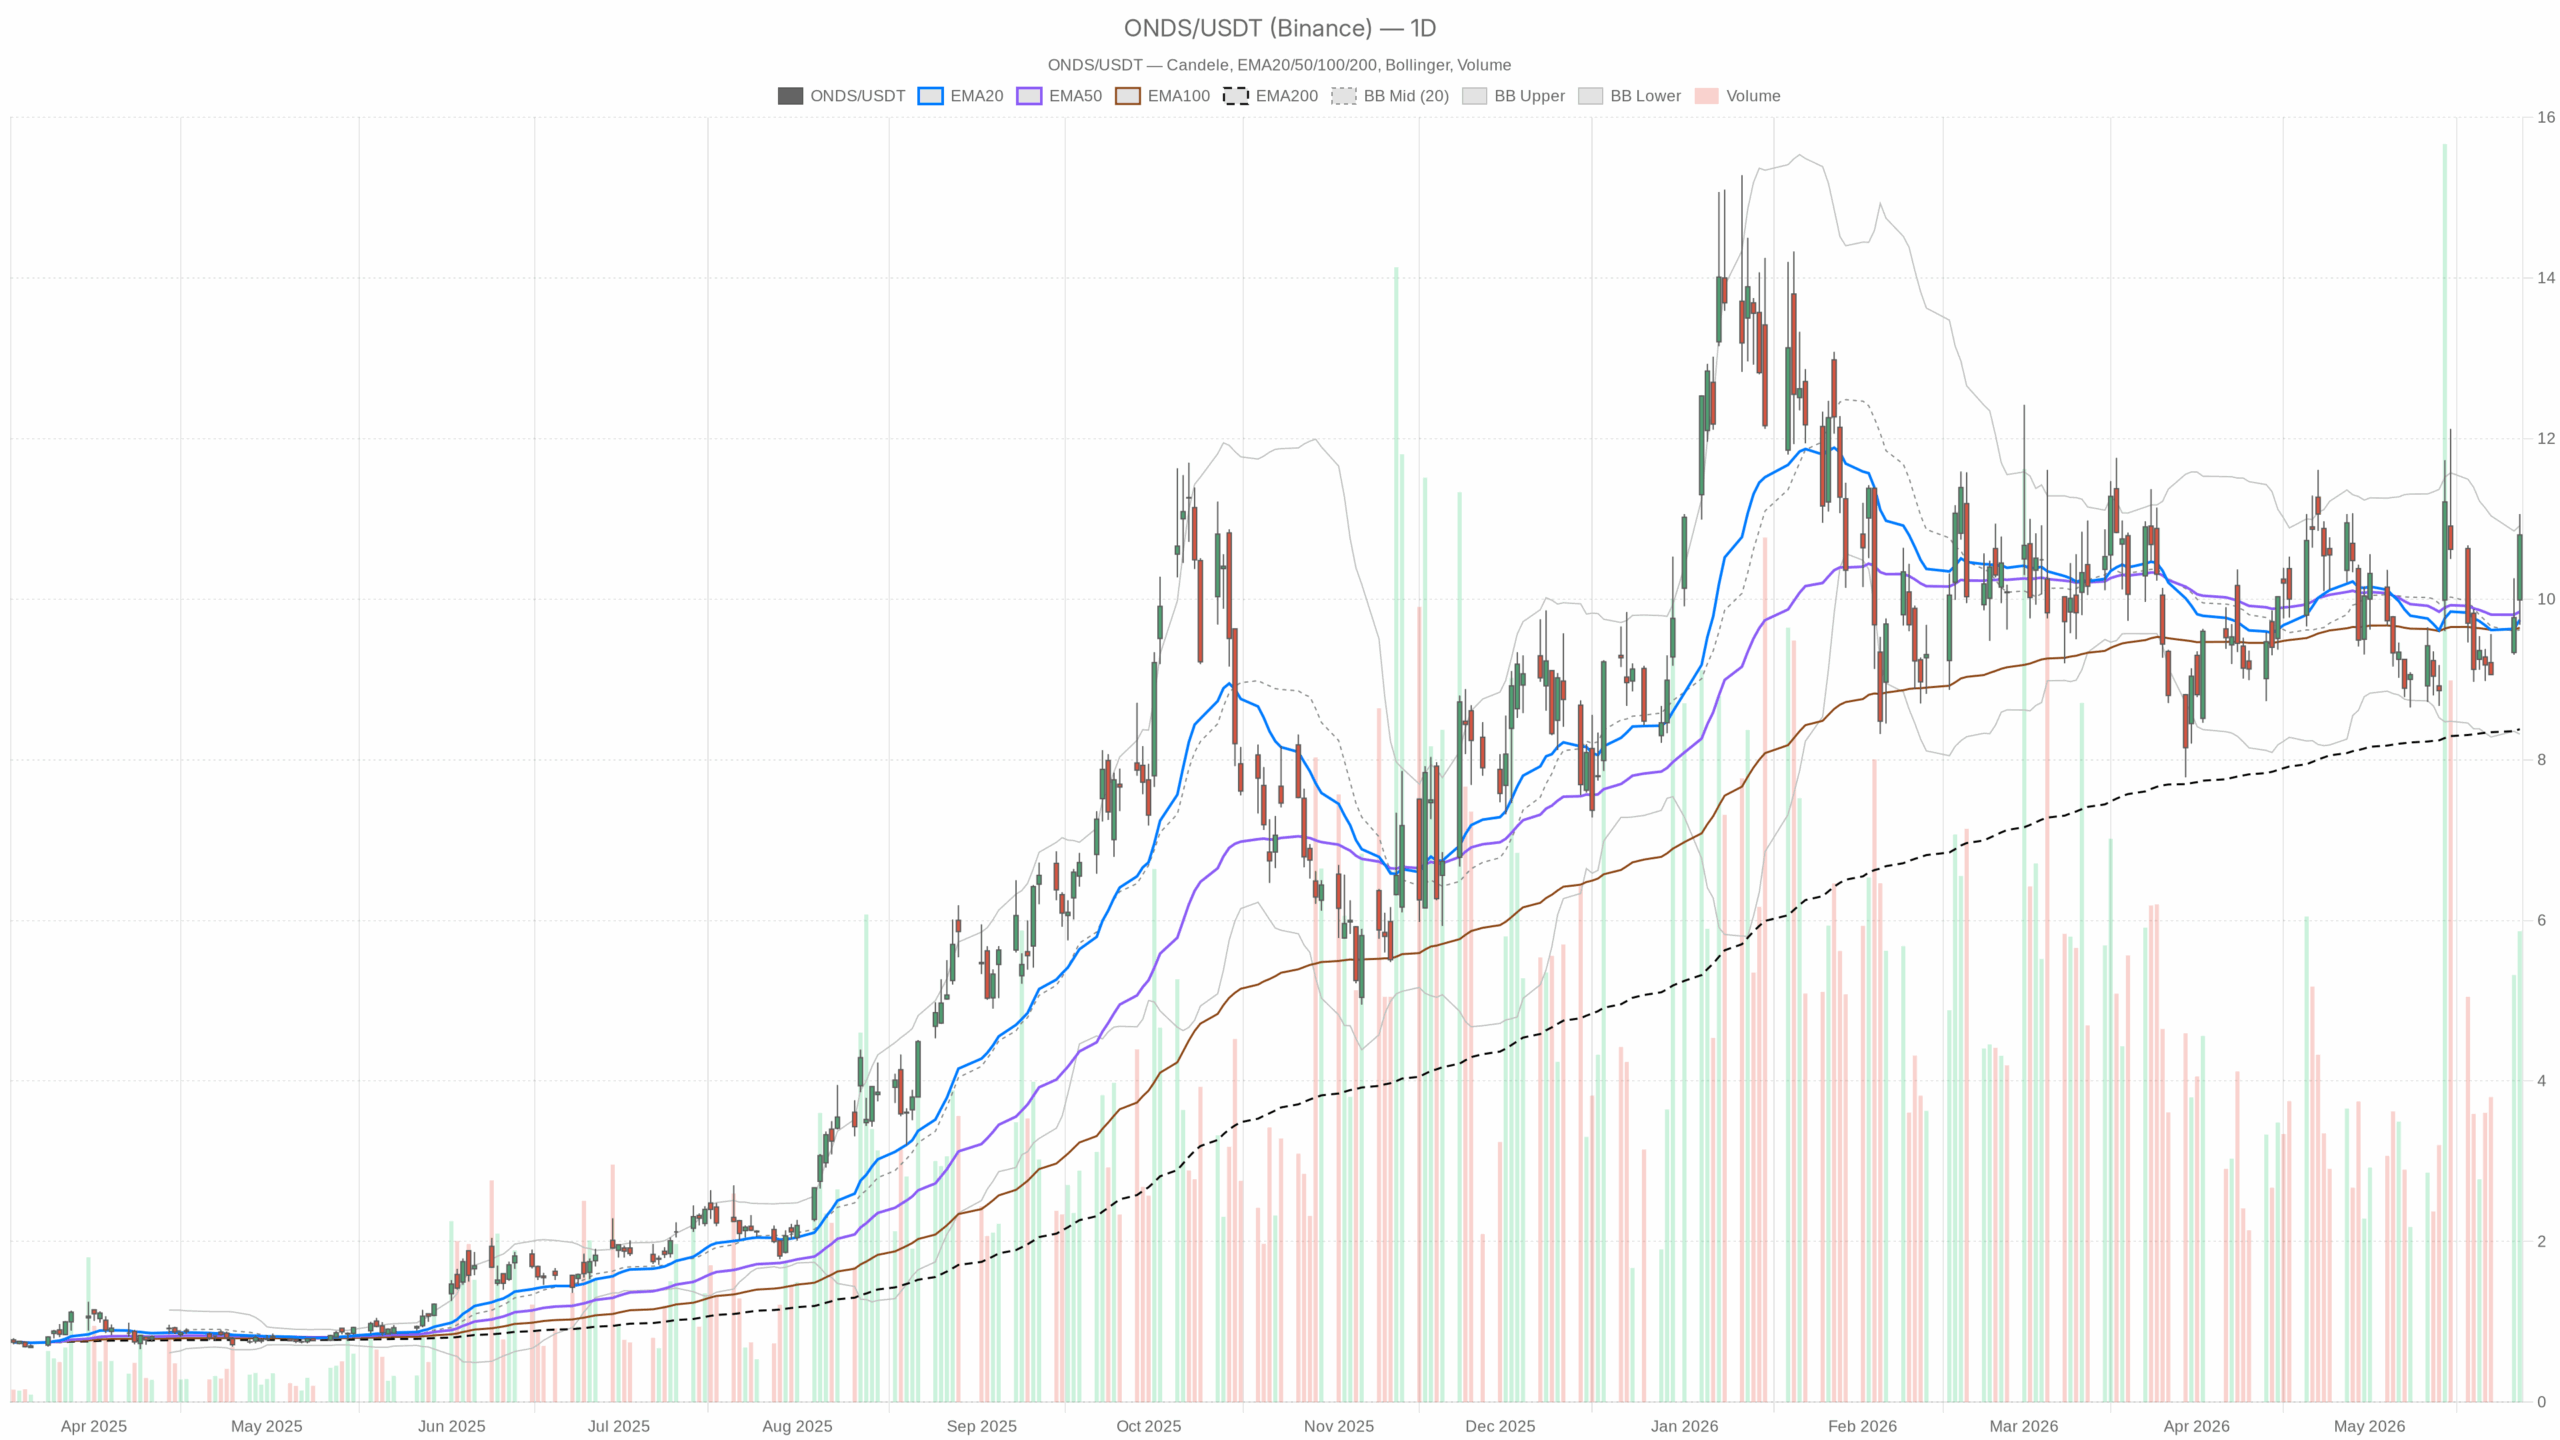 ONDS — daily chart with candlesticks, EMA20/EMA50 and volume.
Onds stock daily technical outlook
On the daily chart, price sits above the 20‑day EMA at 9.74, the 50‑day at 9.84, and the 200‑day at 8.38. That alignment signals improving trend structure. The daily RSI at 57.6 sits in positive territory without being stretched. That reflects constructive momentum. The daily MACD has a line at -0.02 versus a -0.10 signal with a +0.07 histogram. That points to a bullish inflection.
Meanwhile, daily Bollinger Bands center at 9.62 with an upper band at 10.92. Trading near the upper band implies persistent upside pressure but also fade risk. The daily ATR at 0.97 is high for the stock. That warns of wider ranges. Floor‑trader pivots show PP at 10.51, R1 at 11.35, and S1 at 9.97. That frames near‑term levels for continuation or pullback.
ONDS 1‑hour chart: bullish tilt and key levels
On the 1‑hour timeframe, price holds above the 20‑EMA at 10.08, the 50‑EMA at 9.78, and the 200‑EMA at 9.72. That stack underlines an intraday uptrend. However, the 1‑hour RSI at 68.9 is strong and near overbought. That raises odds of a brief cooldown.
The 1‑hour MACD line at 0.35 sits above a 0.23 signal with a +0.12 histogram. That supports trend persistence. Meanwhile, hourly Bollinger Bands have a mid at 9.91 and an upper band at 11.03. Proximity to the upper band flags a resistance pocket. The 1‑hour ATR at 0.38 is elevated for this timeframe. That indicates active intraday swings. Hourly pivots show PP at 10.87, R1 at 10.97, and S1 at 10.68, defining tactical support and resistance for the session.
15‑minute execution: bullish but pausing
On the 15‑minute chart, price sits above the 20‑EMA at 10.60, the 50‑EMA at 10.23, and the 200‑EMA at 9.76. That keeps the micro‑trend up. The 15‑minute RSI at 61.4 is firm. That signals steady but not hot momentum.
However, the 15‑minute MACD line at 0.23 is just over a 0.21 signal with a slim +0.01 histogram. That shows momentum stalling short term. Short‑term Bollinger Bands center at 10.61 with an upper band at 10.99. Trading inside the band suggests a contained consolidation. The 15‑minute ATR at 0.17 is moderate. That implies manageable noise for entries. Intraday pivots put PP at 10.87, R1 at 10.96, and S1 at 10.68. That marks 10.68–10.87 as the first buy‑the‑dip zone if bulls defend it.
Onds stock catalysts and volume
Additionally, volume expanded meaningfully to 91.6 million shares on the day. That showcases event‑driven interest and accumulation‑style, risk‑on behavior.
Notably, drone stocks rallied overnight on reports of potential U.S. support for domestic makers via Pentagon funding and equity stakes. That elevates policy beta for ONDS. Ondas also gained 10.5% into Thursday’s shareholder meeting, adding event risk. The company’s recent addition of high‑margin AI software to its autonomous defense stack underscores its M&A strategy. That offers a fundamental tailwind narrative. Meanwhile, reports of U.S. strikes targeting drones around the Strait of Hormuz kept defense themes in focus. That can amplify headline sensitivity.
Trading scenarios for Onds stock
Bullish scenario: a firm hold above 10.68–10.87 on the 1‑hour pivot zone keeps control with buyers. A push through 10.97–11.06 and the hourly upper band near 11.03 would unlock a run at daily R1 at 11.35. That would align with the daily price pressing the upper Bollinger band at 10.92. Strength in daily RSI and a positive MACD backdrop would back continuation. Rising EMAs across timeframes would also endorse trend follow‑through.
Bearish scenario: however, the path opens if ONDS loses 10.68 and then 10.51 (daily PP) on a closing basis. A failure there invites mean reversion toward daily S1 at 9.97 and the daily Bollinger mid at 9.62. That would likely occur with an hourly RSI rollover from the high 60s and a MACD cross lower. A daily close back under the 50‑day EMA at 9.84 would invalidate the current bullish tilt.
Alignment, risks, and levels to watch
At the same time, timeframes are not perfectly aligned. The daily regime still reads “neutral” even as price sits above all key EMAs. The 1‑hour RSI is near overbought, and the 15‑minute MACD is flattening. That mix can produce chop before direction resolves.
In contrast, if policy headlines firm up and the shareholder meeting passes without negative surprises, dips may stay shallow as buyers defend pivots. Conversely, a soft tape or policy disappointment could see fast air pockets form given the high ATR. That argues for respect of levels rather than assumptions.
Overall, Onds stock is attempting a breakout‑and‑hold above the 10.50 pivot with improving momentum and supportive headlines. Volatility is high, so range awareness matters. Watch 10.68–10.87 for control intraday and 11.03–11.35 overhead. Confirmation or rejection around those bands will likely set the next leg.


You May Also Like

Rumors fly as JD Vance abruptly cancels Colorado event: 'Perhaps he’s worried'

Ethereum Price Today: Standard Chartered Forecasts ETH to Hit $4,000

Exclusive interview with Smokey The Bera, co-founder of Berachain: How the innovative PoL public chain solves the liquidity problem and may be launched in a few months



