

Sei price nears bearish breakout as transactions plunge 87%
Sei price has crashed to an important support level and formed a descending triangle as the number of transactions and active addresses plunged in September.
- Sei crypto price has formed a descending triangle pattern.
- The number of transactions plunged by 87% in the last 30 days.
- Sei’s unique active wallets fell by 20% in the same period.
Sei (SEI), a popular layer-1 network, plunged to the key support at $0.2645, its lowest level in August and September this year.
Data compiled by Nansen show that the number of transactions plunged by 87% in the last 30 days to 57 million. This crash makes it one of the worst-performing chains in September.
The data show that active addresses dropped by 24% to 13 million. Also, fees dropped by about 12% to just $16,000.
Sei’s performance in the gaming market, where it dominates, also deteriorated. According to DappRadar, the number of unique active wallets dropped by 20% in the last 30 days to 13.45 million.
More data shows that its total value locked plunged by 17% in the last 30 days. Most notably, Sei’s stablecoin supply dropped to $140 million, its lowest level since March and much lower than the year-to-date high of $296 million.
Sei price technical analysis
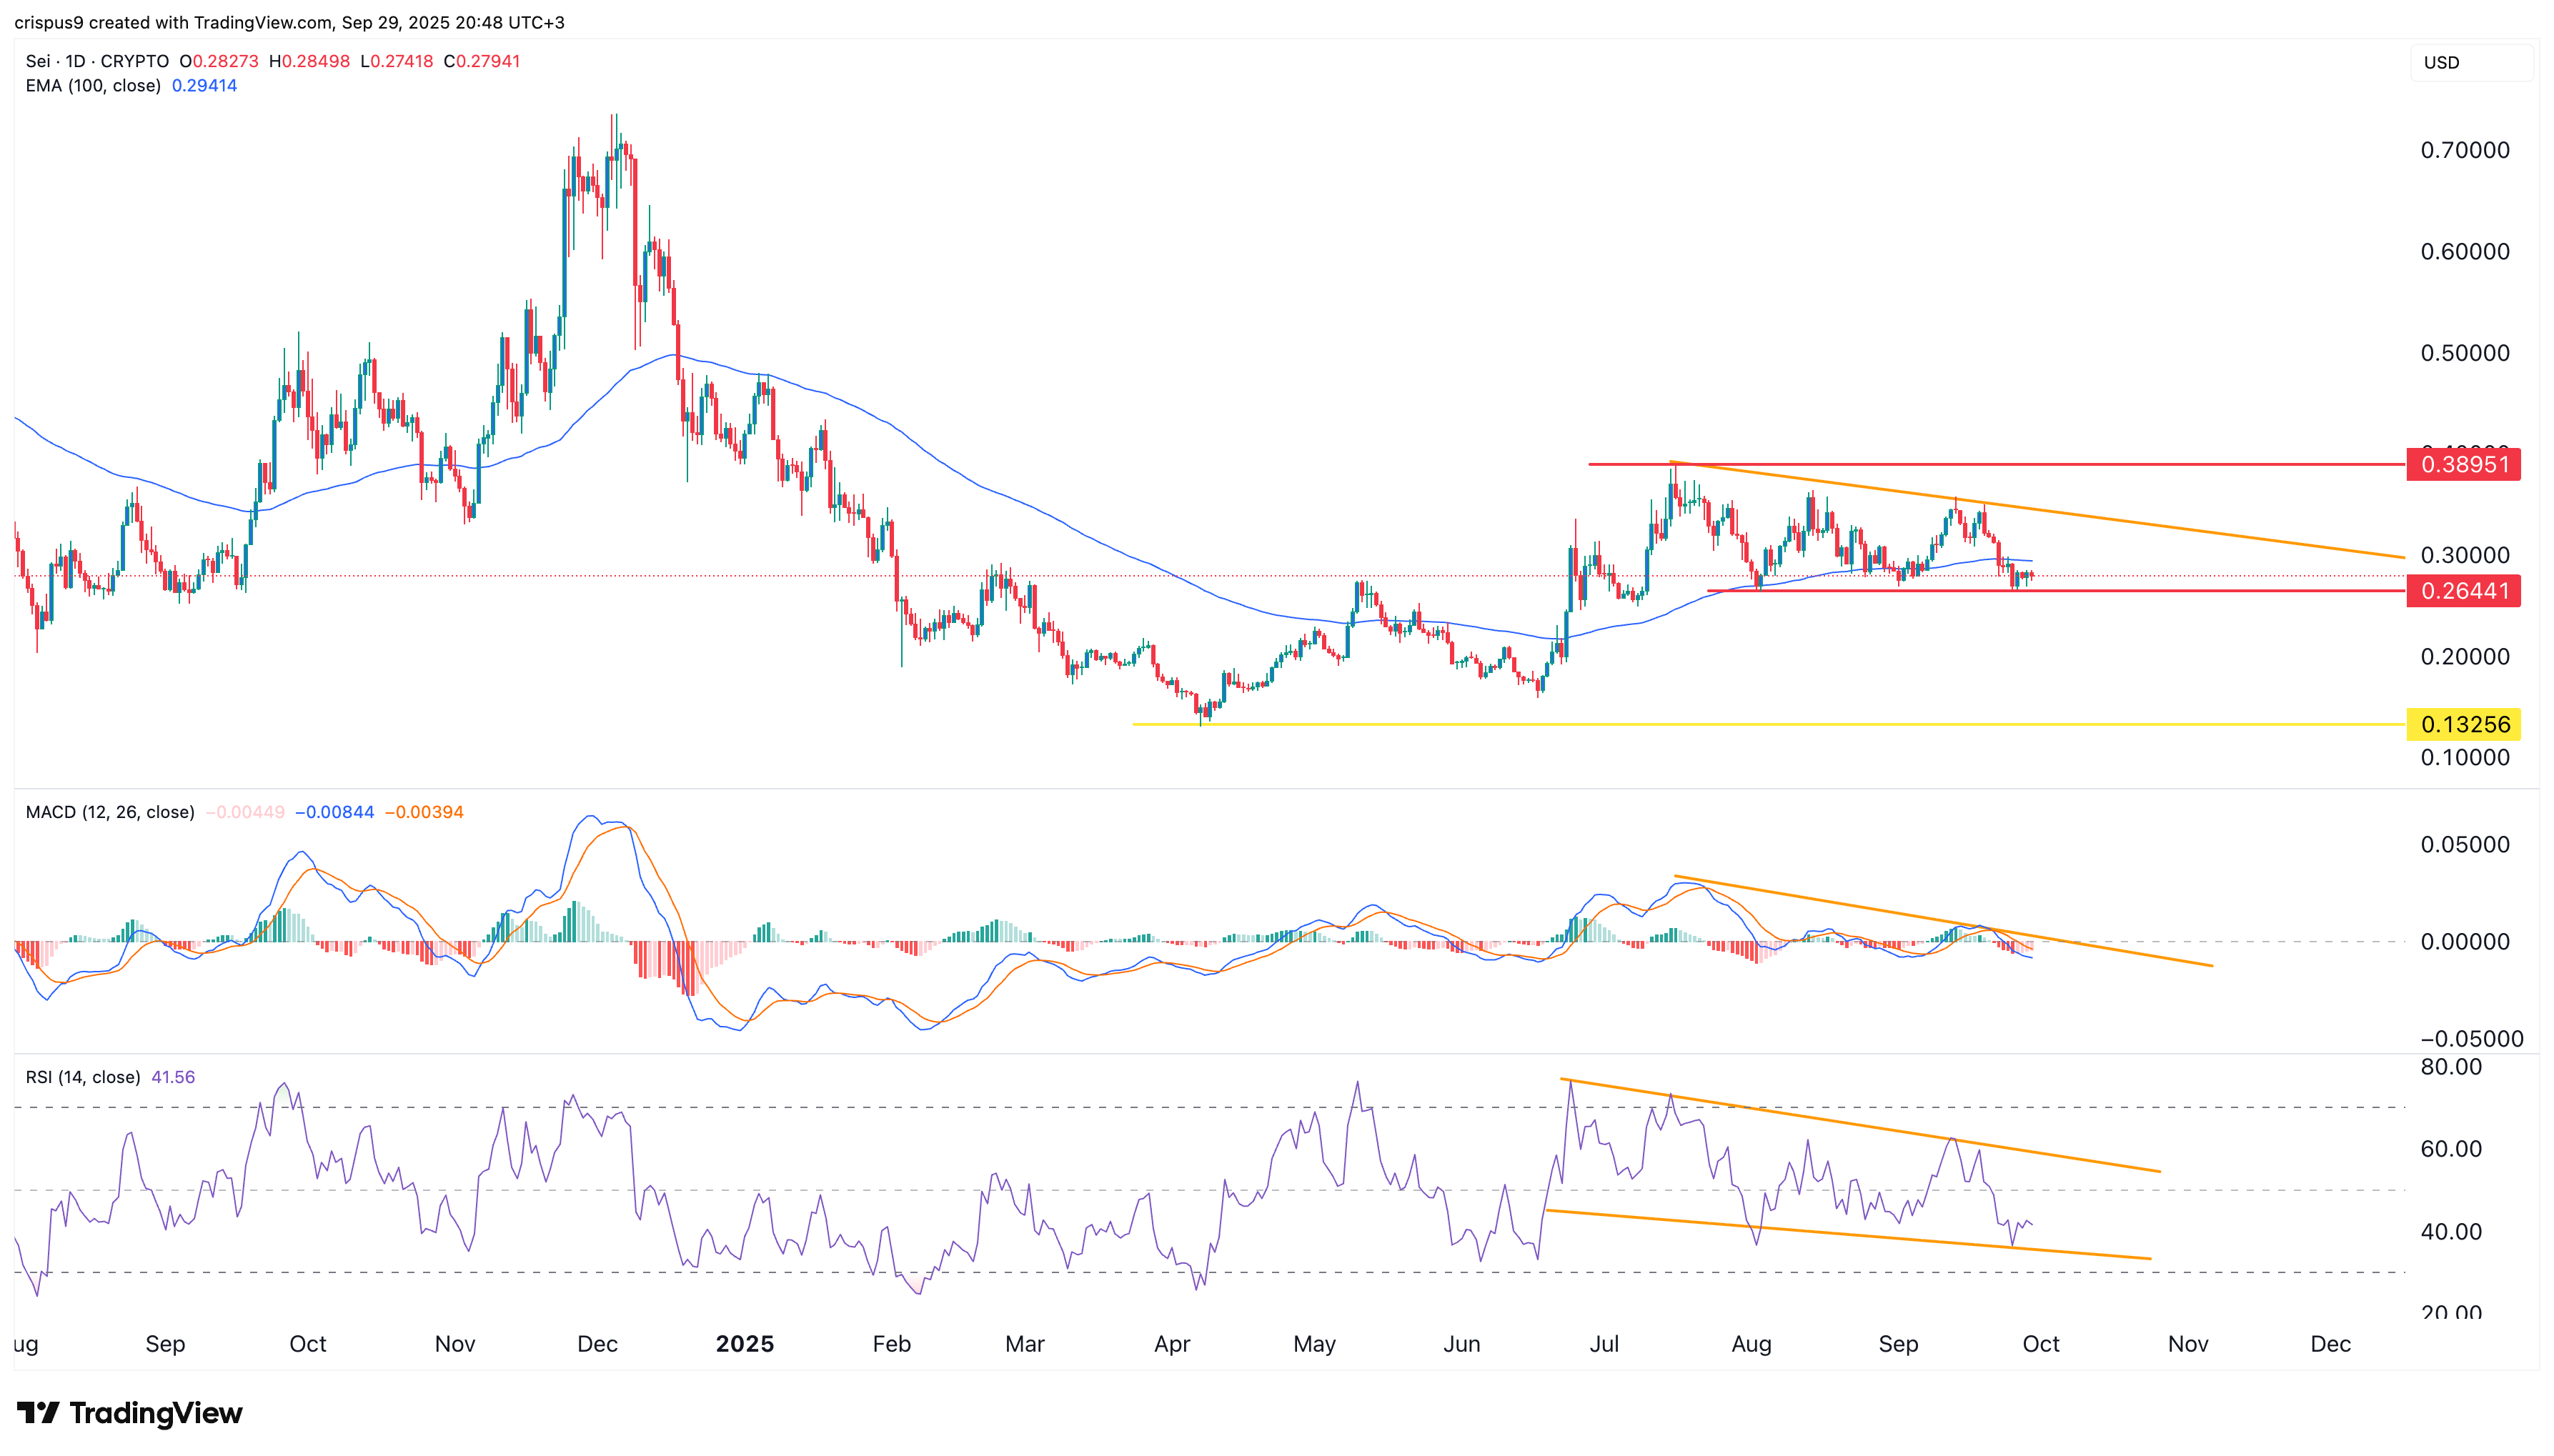
The daily timeframe chart shows that the Sei token price peaked at $0.3895 in July and then dropped to a low of $0.2645. It has crashed below the 50-day exponential moving average.
Sei crypto price has formed a descending triangle pattern whose support is at $0.2645. This is one of the most popular bearish continuation signs.
The Relative Strength Index has been in a downward trend. It has moved close to the oversold level of 70, while the MACD has moved below the neutral level.
Therefore, the token will likely have a strong bearish breakout, with the next point to watch at $0.1325, its lowest level this year. This target is about 50% below the current level. A move above resistance at $0.3500 will invalidate the bearish Sei price forecast.


You May Also Like

Coinbase CEO Push Bitcoin Quantum Resistance Price Stay Weak

Bitcoin Exchange Binance Announces New Listings on its Futures Platform! Here Are the Details


