

Strategy Stock’s $54B Bitcoin Bet Faces a Bearish Wall at $140
Strategy Stock (MSTR) is navigating a tense technical crossroads. At $123.97 on June 12, the daily chart remains firmly bearish, while short-term momentum attempts a fragile recovery. The dominant trend points lower, making any bounce a counter-trend move until the daily structure repairs itself.
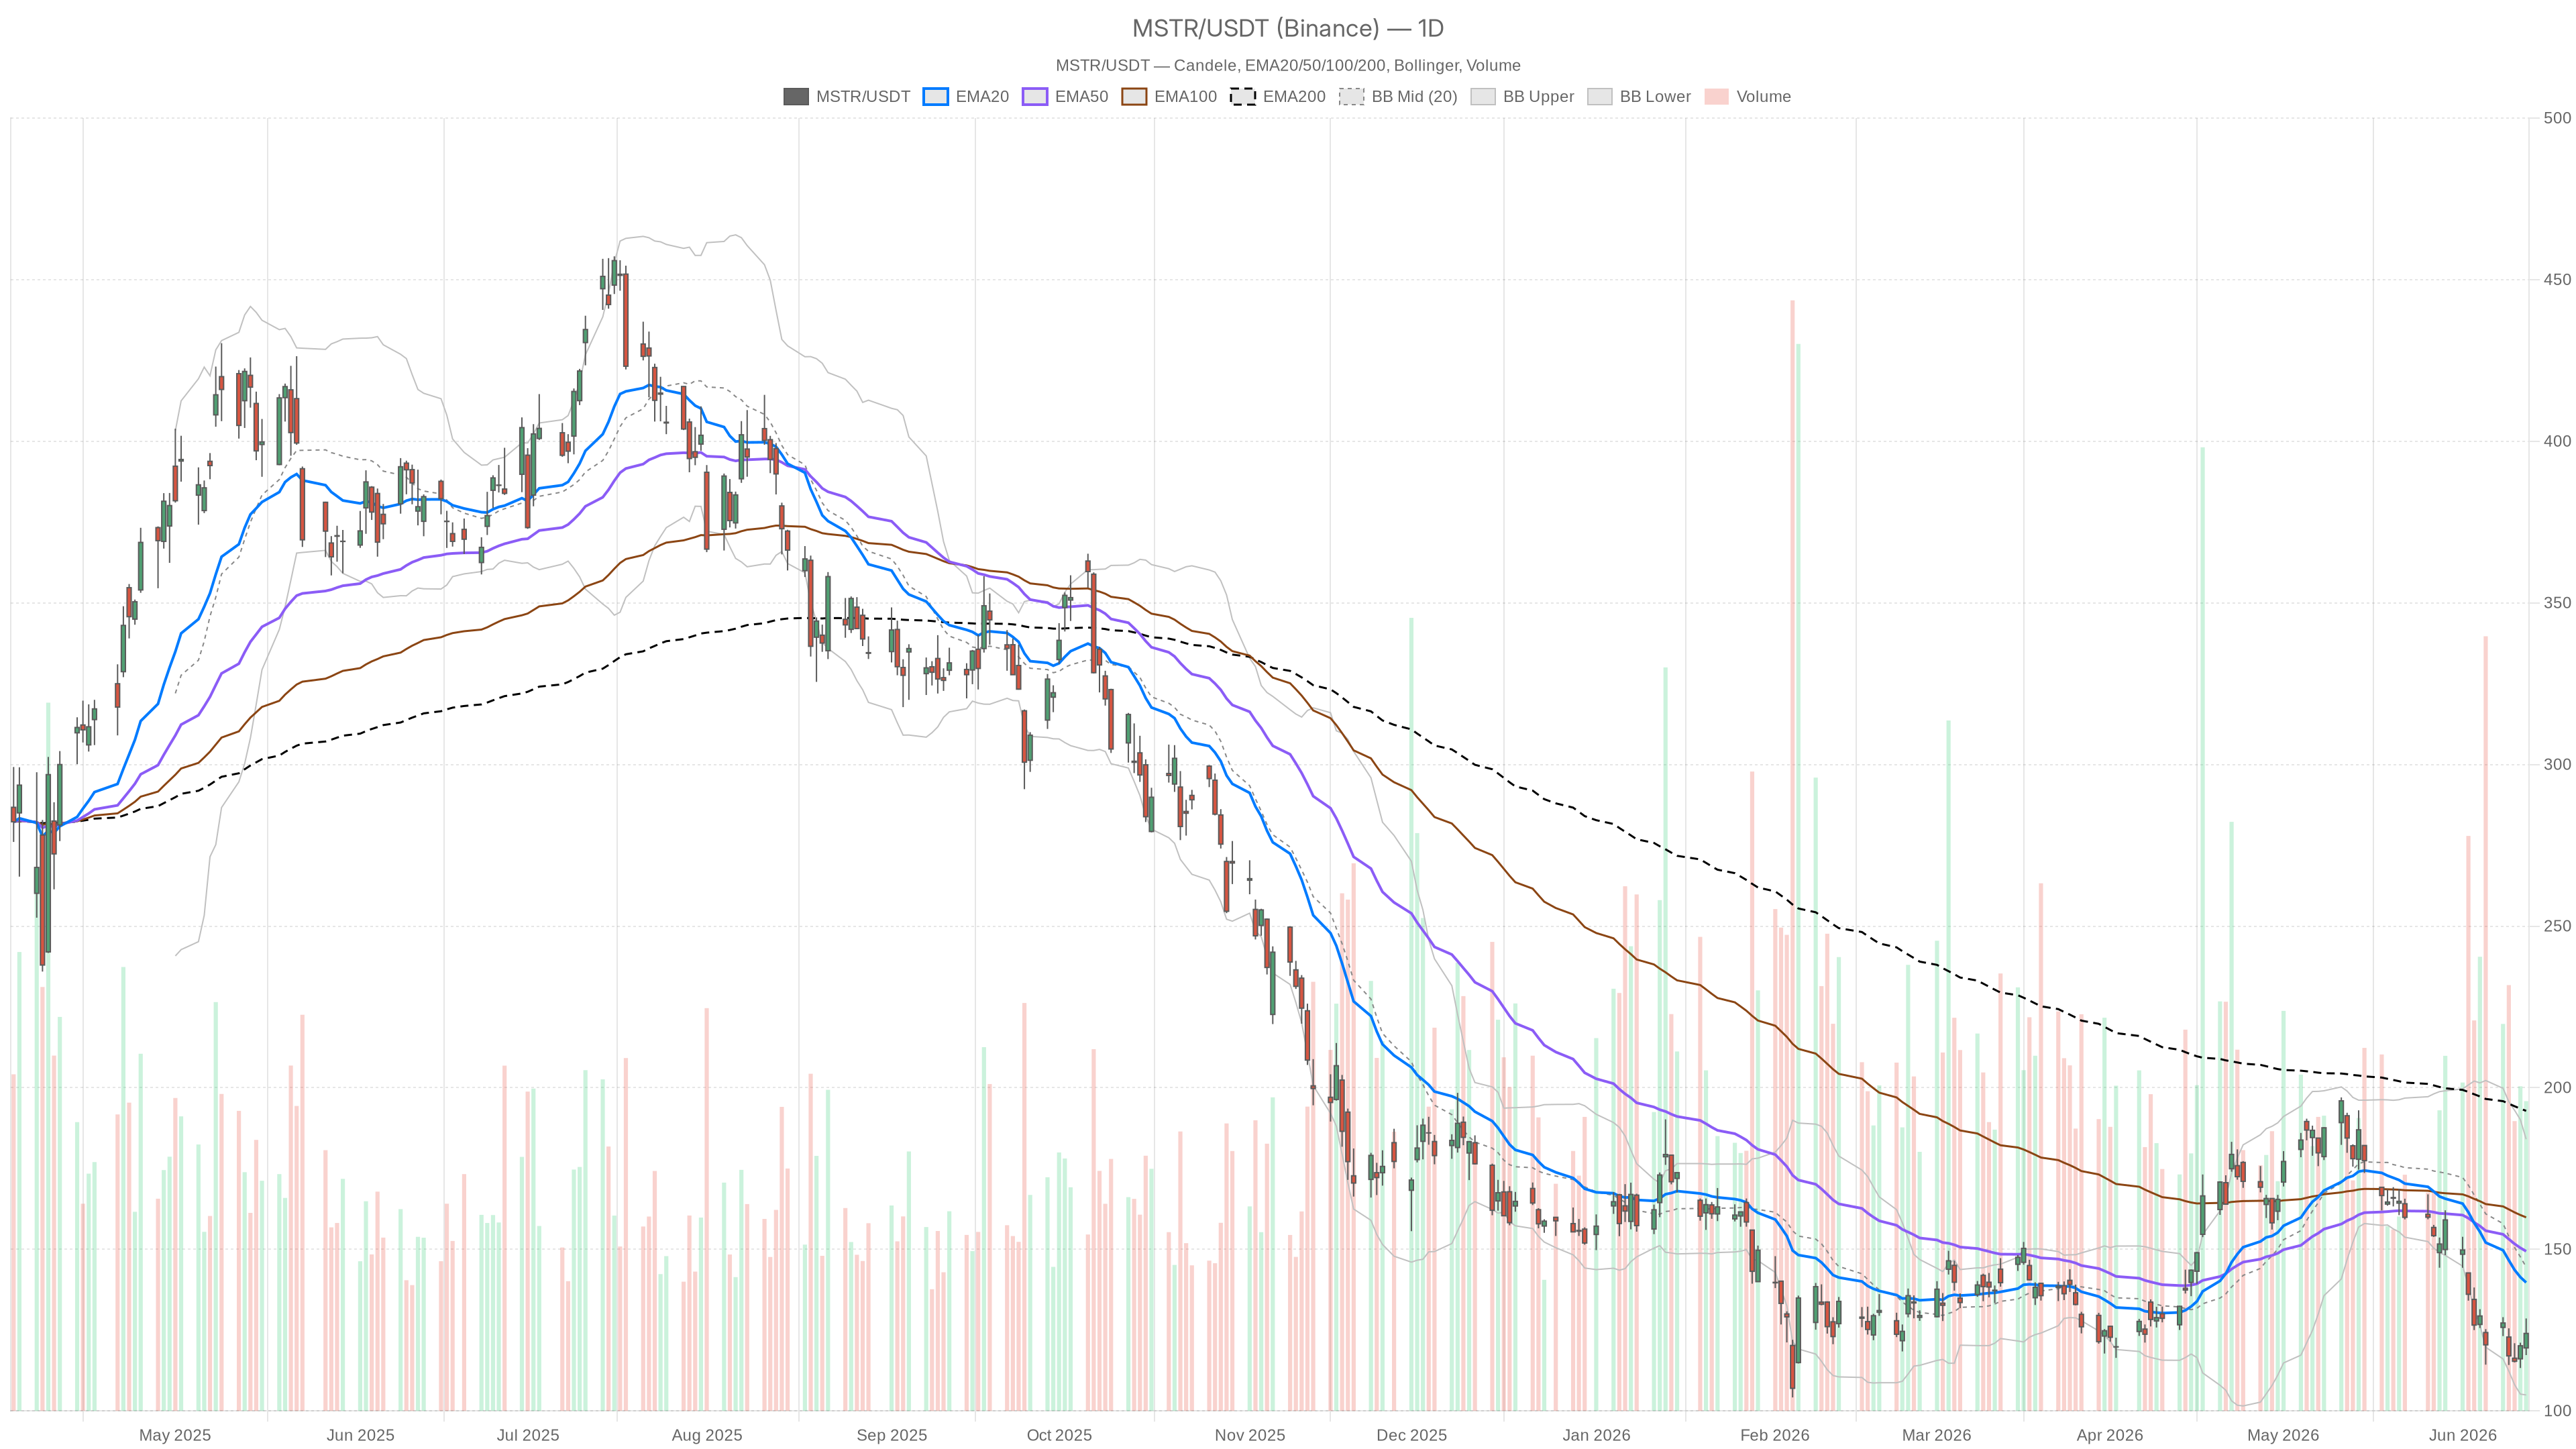 MSTR — daily chart with candlesticks, EMA20/EMA50 and volume.
Key takeaways
- Strategy Stock closed at $123.97, trading below all three daily EMAs — EMA20 at $139.72, EMA50 at $149.40, and EMA200 at $192.82 — confirming a bearish cascade.
- Daily RSI at 37.22 and MACD histogram at -3.06 signal sustained selling pressure with no imminent bullish crossover on the daily chart.
- The hourly chart shows a short-term recovery attempt, with price above the 1H EMA20 ($121.27) and a positive MACD crossover at 0.98.
- ATR14 at $10.63 indicates elevated volatility, requiring careful position sizing for any trade in Strategy Stock.
- The bearish scenario remains the higher-probability path unless MSTR reclaims the daily EMA20 near $139.72.
Daily Trend Structure Remains Decisively Bearish
The daily chart leaves no room for bullish interpretation. MSTR’s EMA cascade confirms the trend has been deteriorating across multiple timeframes. Price closing at $123.97 beneath all three exponential averages reflects sustained institutional selling rather than a brief consolidation phase.
Specifically, the EMA20 sits at $139.72, the EMA50 at $149.40, and the EMA200 at $192.82 — all stacked well above current price. This configuration signals that the bearish trend is not merely a short-term pullback. It has been building across weeks and months, reinforced by each successive failure to reclaim these levels.
Momentum Indicators Deepen the Bearish Case
The daily RSI14 reads 37.22. This is not yet at oversold extremes, which means sellers still have room to push lower before exhaustion sets in. More importantly, the MACD paints an equally sobering picture. The MACD line sits at -12.45 against a signal of -9.39, producing a histogram of -3.06. The divergence is widening rather than contracting, ruling out any near-term bullish crossover on the daily timeframe.
Volatility Context and Pivot Reference Points
Bollinger Bands on the daily frame add useful structural context. The midline is at $144.50, the upper band at $184.07, and the lower band at $104.93. Current price trades between the midline and the lower band. This is a zone that favors continued downside pressure unless buyers step in convincingly. The ATR14 at $10.63 confirms this is a volatile name, with daily swings of that magnitude being routine.
Meanwhile, daily pivot levels place the pivot point at $123.28, R1 at $129.29, and S1 at $117.96. MSTR closed just above the daily pivot, offering a marginal positive signal. However, R1 at $129.29 represents the first meaningful resistance test. Reaching it would require roughly a 4% intraday extension from current levels. S1 at $117.96 is the immediate downside reference if sellers reassert control.
Short-Term Recovery Attempt Gains Traction
The hourly chart introduces a more nuanced picture, shifting the regime from bearish to neutral. Several short-term indicators show a recovery gaining traction on MSTR, even though the larger daily structure remains damaged and firmly in bearish territory.
Hourly Chart Shows Constructive Momentum
On the 1H frame, price at $123.96 sits above the 1H EMA20 at $121.27 — a constructive sign for short-term bulls. The 1H MACD has turned positive, with the line at 0.66 crossing above the signal at -0.32. This produces a histogram of 0.98, reflecting genuine short-term buying pressure rather than noise. Meanwhile, the 1H RSI at 57.33 supports the recovery narrative, sitting comfortably above the 50 midline. However, the 1H EMA50 at $124.57 and EMA200 at $145.17 still sit above price. The bounce is real, but it plays out within a larger damaged framework.
15-Minute Resistance Caps the Intraday Bounce
On the 15-minute chart, price is rangebound near $123.96. The EMA20 at $123.32 and EMA50 at $121.62 now sit below current price — a mild short-term positive. However, the 15m MACD histogram has turned slightly negative at -0.26 after a prior positive read. This hints that the near-term pop is running into minor resistance. The 15m pivot levels are tight: PP at $123.83, R1 at $124.22, and S1 at $123.58. Price is pressing against the 15m R1 zone, where short-term sellers may reassert pressure.
News Catalysts and Sentiment Backdrop
The news backdrop adds complexity to Strategy Stock’s technical picture. Recent developments reinforce the leveraged crypto-exposure narrative while introducing valid concerns about the cost of that exposure.
Reports confirm that Strategy recently added 1,550 bitcoin to its holdings, bringing its total stash to a $54 billion position. The firm is explicitly engineered as a compounding vehicle for bitcoin exposure, and that narrative continues to attract speculative interest. Smart money was reportedly accumulating $6 million in bullish bets following the 41% decline, with analysts flagging a potential rebound capped near $163. In contrast, a Seeking Alpha analysis flagged the ongoing leverage cost as expensive relative to bitcoin’s underlying price action — a valid concern if bitcoin’s drawdown extends further.
Bullish and Bearish Scenarios for Strategy Stock
Two distinct scenarios define Strategy Stock’s path forward, and the bearish case remains the higher-probability outcome given the daily structure. However, a crypto-driven recovery could rapidly alter the equation if bitcoin finds a durable floor.
There is an inherent tension in MSTR’s structure that traders must respect. The stock’s performance is largely a leveraged derivative of bitcoin sentiment. A broader crypto recovery could compress MSTR’s discount to NAV and drive a sharp mean-reversion rally. That is the bullish scenario: bitcoin stabilizes or advances, the daily EMA20 gets reclaimed near $139.72, and the MACD histogram begins contracting toward zero. In that environment, R1 at $129.29 becomes a stepping stone rather than a ceiling, and the smart money positioning cited in recent headlines starts paying off.
On the other hand, the bearish scenario holds greater weight given current daily structure. If MSTR fails to hold above the daily pivot around $123.28, S1 at $117.96 comes into focus quickly. Below that, the lower Bollinger Band at $104.93 represents the next structural floor. Continued MACD divergence on the daily chart without any histogram improvement would validate sustained distribution. In that case, the hourly recovery attempt would simply become a lower high within a broader downtrend — exactly what bearish regime trends produce.
Multi-Timeframe Trading Implications
The conflict between the daily bearish regime and the hourly neutral-to-positive readings is the central tension for traders to manage. Until MSTR reclaims its daily EMA20, any long exposure carries the risk of fading into the dominant trend rather than participating in a genuine recovery.
Overall, volatility remains elevated with a daily ATR near $10.63, meaning position sizing must account for wide intraday swings. The multi-timeframe picture is one of a bearish daily trend with a fragile short-term bounce. Short-term longs require tight risk management and a clear understanding that they are trading against the dominant trend. Until the MACD histogram turns positive on the daily chart and price reclaims the EMA20 near $139.72, the bearish regime remains firmly in control.
FAQ
Is Strategy Stock in a bear market?
Strategy Stock is in a confirmed bearish trend on the daily timeframe. Price at $123.97 sits well below all three major exponential moving averages — the EMA20 at $139.72, EMA50 at $149.40, and EMA200 at $192.82. The daily RSI at 37.22 and widening MACD divergence further confirm that selling pressure remains the dominant force.
Can Strategy Stock recover in the short term?
A short-term recovery is already underway on the hourly chart. The 1H MACD has turned positive at 0.98, and price is above the 1H EMA20 at $121.27. However, this bounce remains fragile and must contend with the larger bearish daily structure. Reclaiming the daily EMA20 near $139.72 would be the first meaningful signal of a genuine trend reversal.
What are the key levels to watch for Strategy Stock?
Key resistance sits at the daily R1 of $129.29, followed by the daily EMA20 at $139.72. On the downside, immediate support is at the daily pivot of $123.28, with S1 at $117.96 and the lower Bollinger Band at $104.93 serving as deeper structural floors.
How does bitcoin affect Strategy Stock’s price?
MSTR is largely a leveraged derivative of bitcoin sentiment. The firm holds a $54 billion bitcoin position, making the stock highly sensitive to crypto price movements. A bitcoin recovery could compress MSTR’s discount to NAV, while further crypto weakness would likely deepen the stock’s drawdown.
Disclaimer: This article is for informational purposes only and does not constitute financial advice, an investment recommendation, or a solicitation to buy or sell any financial instrument or cryptocurrency. The analysis provided is not indicative of future results. Investing in crypto assets and financial markets carries a high risk of capital loss. Always do your own research (DYOR) and consult a qualified financial advisor before making any decision.
Article produced with the assistance of artificial intelligence and reviewed by the editorial team.


You May Also Like

Expert taken aback as Trump aides rejected 'outrageous' habeas corpus proposal

Ethereum Whale Moves $53.1 Million to FalconX, Hinting at Potential Sell-Off

Ondo Finance Launches USDY Yieldcoin on Stellar, Bringing Tokenized U.S. Treasuries to Users


