

HSBC Stock Nears $95 Ceiling as Momentum Signals Flash Warning
HSBC stock closed at $94.45 on June 16, maintaining a bullish daily structure above key moving averages. While the broader uptrend remains intact, fading short-term momentum near resistance at $95.14 warrants caution before assuming immediate further upside.
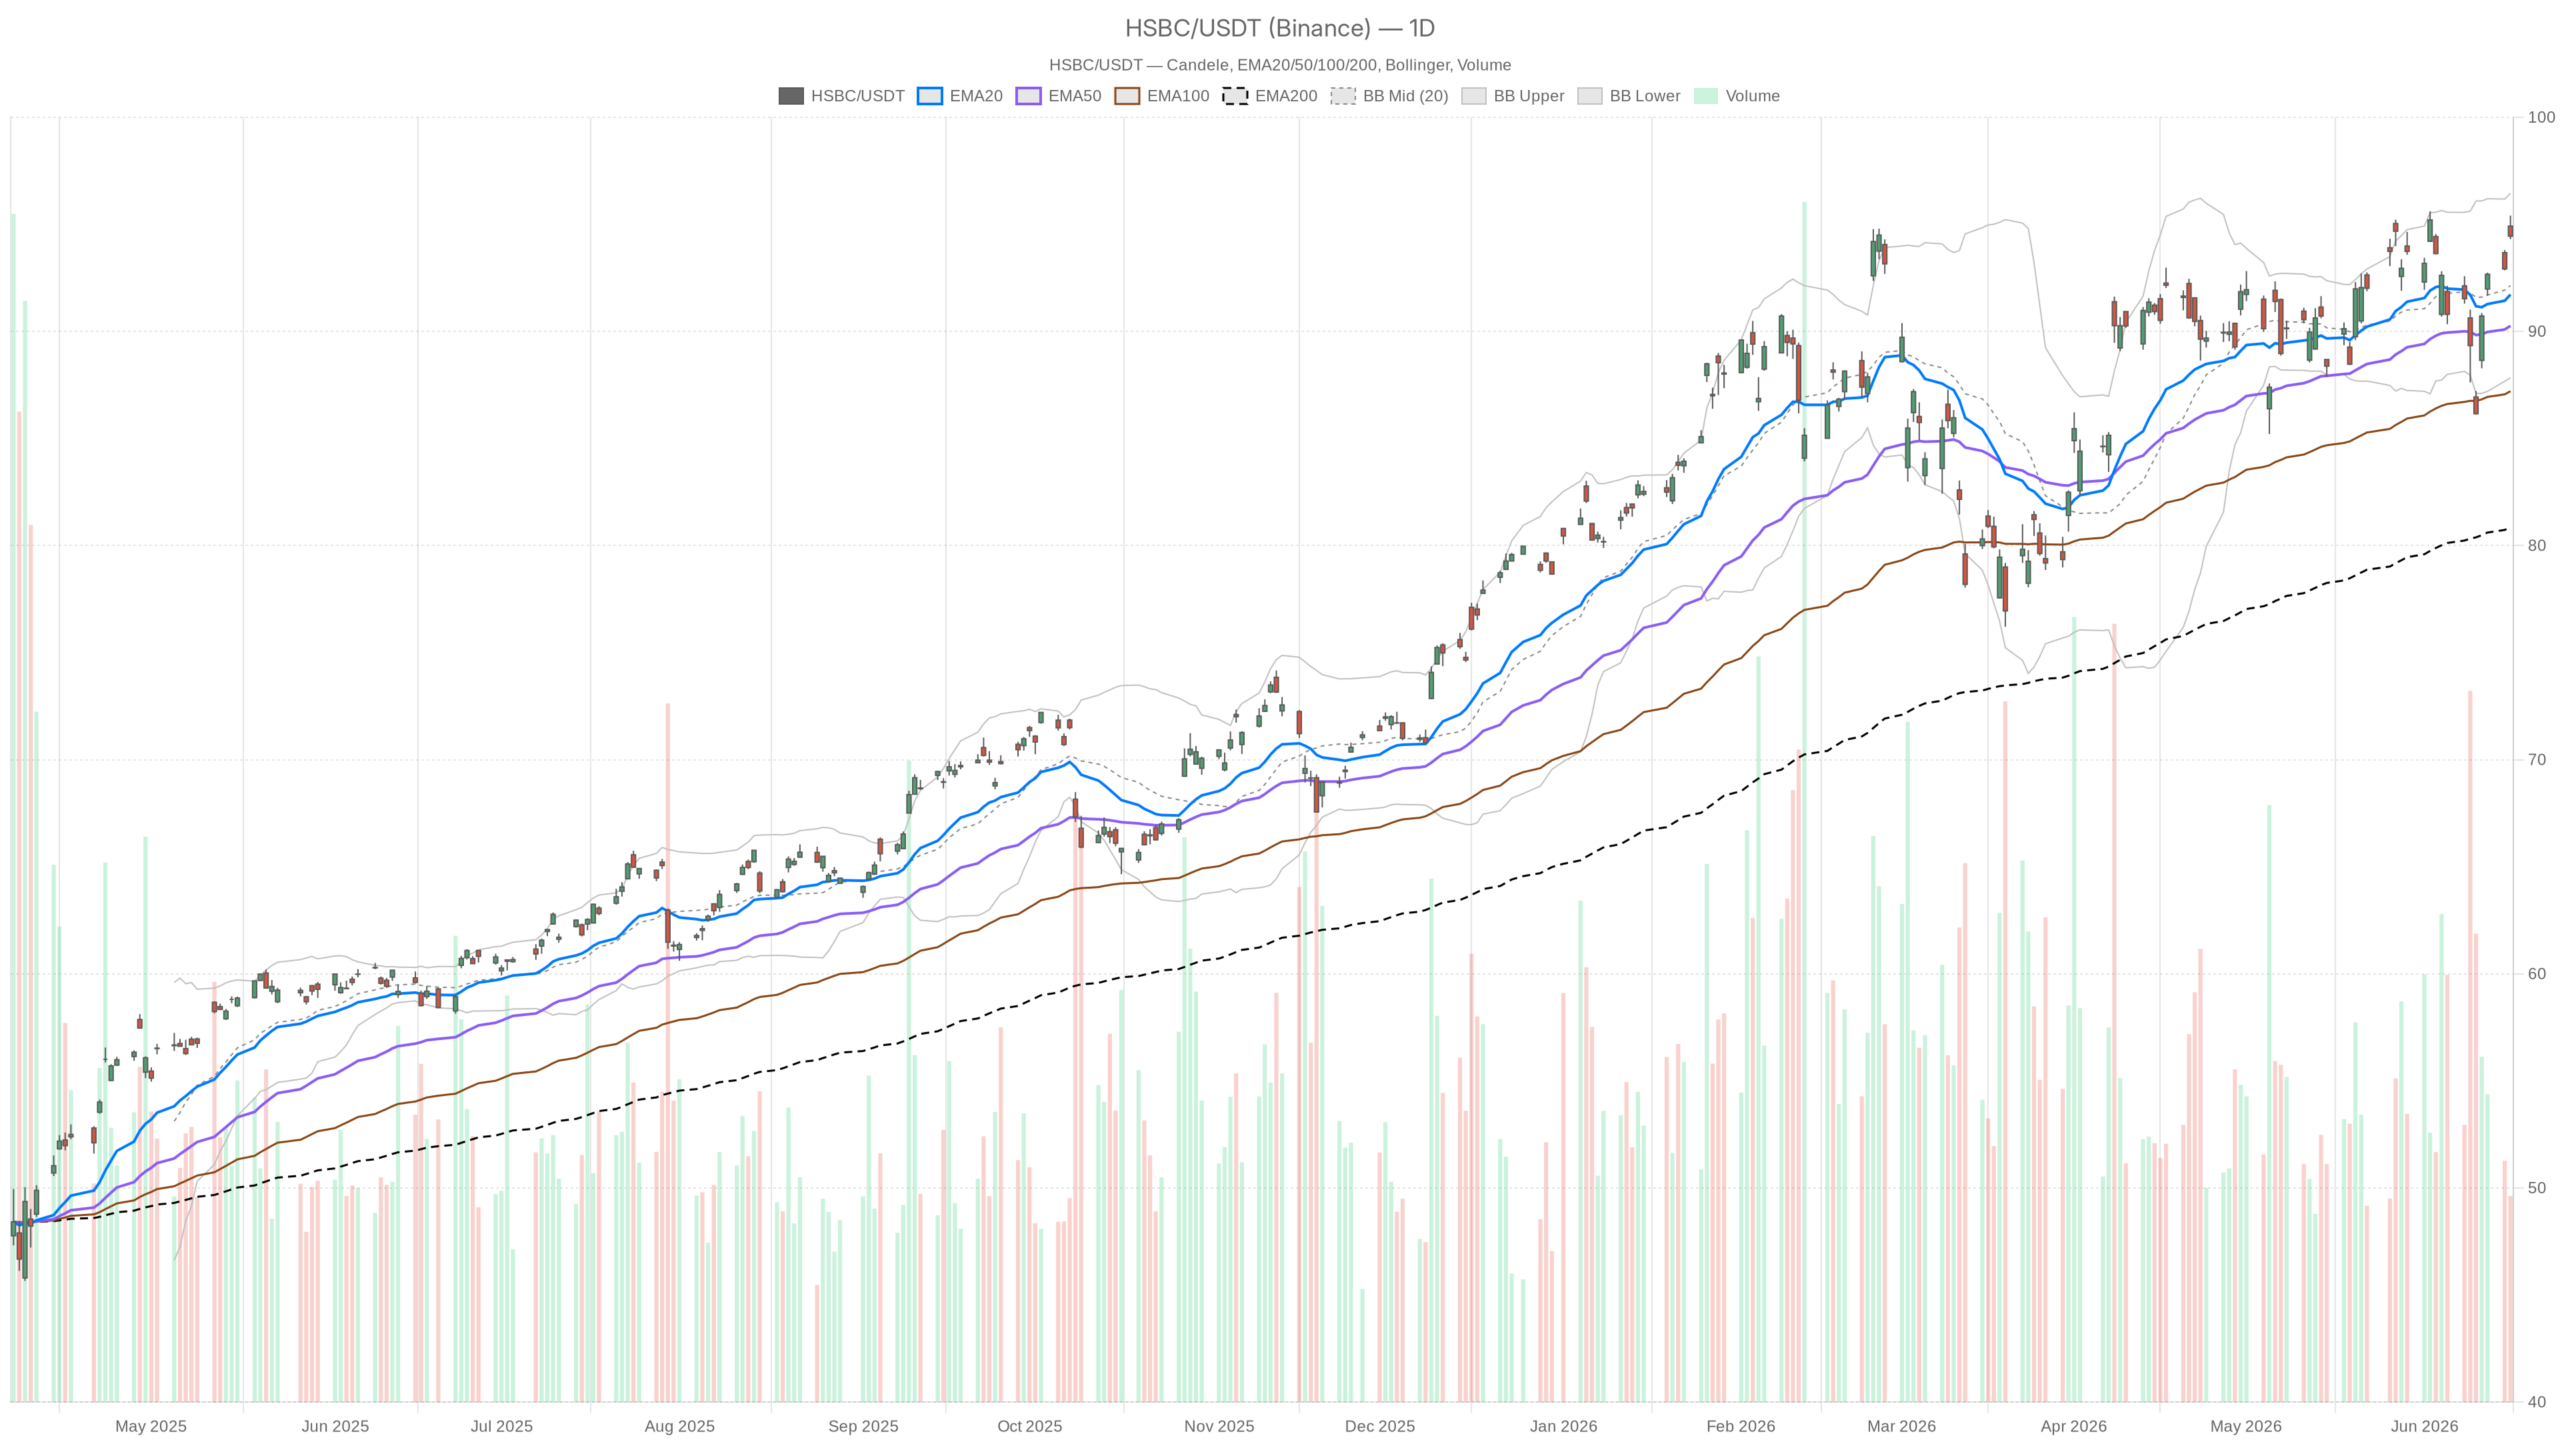 HSBC — daily chart with candlesticks, EMA20/EMA50 and volume.
Key takeaways
- HSBC stock closed at $94.45, trading above the EMA20 ($91.72), EMA50 ($90.26), and EMA200 ($80.87) in a stacked bullish alignment.
- Daily RSI at 57.23 signals constructive momentum with room to run before overbought conditions emerge.
- Near-term resistance sits at $95.14 (R1), with critical support at $94.04 (S1) and the daily EMA20 at $91.72.
- A strategic AI partnership with Google Cloud targets over $100 million in additional revenue or cost savings across 200 AI-driven tasks.
- Short-term indicators on the 15-minute chart flash exhaustion signals despite the intact daily uptrend.
HSBC Stock Daily Trend Structure
The daily chart tells a clear story. HSBC stock trades above its EMA20 at $91.72, EMA50 at $90.26, and well above the EMA200 at $80.87. That stacked alignment — price above all three exponential averages, with shorter-term EMAs above longer-term ones — is a textbook expression of trend health. It signals sustained buying pressure over multiple time horizons.
The daily RSI sits at 57.23, a constructive reading. It reflects positive momentum without the overextension risk that comes with readings above 70. There is room to run higher before exhaustion becomes a meaningful concern. Meanwhile, the daily MACD tells a more nuanced story. The MACD line at 0.47 has barely crossed above the signal line at 0.46, producing a histogram of just 0.01. The bullish signal is there — but it is barely breathing. This is a momentum structure that is recovering, not accelerating.
Daily Bands and Pivot Levels
Bollinger Bands on the daily frame place the mid-band at $92.14. The upper band sits at $96.45 and the lower at $87.84. The current price at $94.45 is above the mid-band, confirming the bullish regime. However, the upper band at $96.45 represents a natural ceiling in the near term. The daily ATR of $2.49 gives a sense of how much ground HSBC stock can cover in a single session. The range is wide enough for meaningful swings, but not extreme volatility.
Daily pivot analysis is tight. The pivot point sits at $94.72, with resistance at R1 of $95.14 and support at S1 of $94.04. HSBC stock closed fractionally below the daily pivot. This minor negative keeps the stock in a zone of indecision heading into the next session. A clean break and hold above $95.14 would be the first meaningful confirmation that the daily trend is resuming its upward push.
Short-Term Momentum Fades Across Lower Timeframes
On the 1-hour chart, the bullish bias is confirmed — but with a caveat. The hourly RSI is elevated at 67.02, pushing toward the 70 threshold that typically signals near-term overextension. Price is above the hourly EMA20 at $93.37, EMA50 at $92.18, and EMA200 at $91.60. This reinforces the short-term trend. The MACD on this timeframe shows a histogram of 0.02 — again positive, but barely so. The rally that built up over recent hours appears to be plateauing rather than accelerating.
Notably, the hourly Bollinger Bands place the upper band at $95.48. At current prices just below $94.50, HSBC stock still has some technical breathing room before bumping against that ceiling. However, with RSI nearing overbought, a brief consolidation on the 1-hour frame looks likely. That would be entirely consistent with a healthy continuation of the daily uptrend.
15-Minute Signals Point to Exhaustion
The 15-minute chart complicates the near-term picture. The MACD histogram has turned negative at -0.12, with the MACD line at 0.09 crossing below the signal at 0.22. That is a short-term bearish momentum signal. The RSI at 49.27 is roughly neutral — neither oversold nor showing buying conviction. Price is sitting fractionally below the 15-minute EMA20 at $94.57, and the regime reading is neutral.
In contrast to the daily and hourly bullish setups, the 15-minute frame is flashing a soft warning. Very short-term selling pressure is incrementally outpacing buying. This does not challenge the broader thesis. But it does suggest that immediate upside momentum is limited. For traders focused on entry timing, the 15-minute setup argues for patience rather than urgency.
Fundamental Catalysts Supporting HSBC Stock
On the fundamental side, two developments stand out. HSBC announced a strategic partnership with Google Cloud to deploy AI across its global operations. The initiative targets over $100 million in additional revenue or cost savings, with 200 new AI-driven tasks planned over two years. For a bank of HSBC’s size, operational efficiency gains of that magnitude are material. The market has reason to view this positively over the medium term.
At the same time, HSBC confirmed its first interim dividend of $0.10 per share for 2026. The figure is modest in isolation. However, it reinforces management’s confidence in capital generation. The bank also publicly stated it sees limited risk from the Federal Reserve’s FOMC deliberations. It is recommending equity exposure to its clients — a constructive macro stance reflecting internal optimism about the rate environment.
On the other hand, a Bloomberg report flagged $400 million in HSBC exposure to IFFCO Group, an ailing UAE-based consumer goods conglomerate. CEO Georges Elhedery has been working to streamline the bank’s capital discipline. This exposure adds a degree of credit risk that investors should monitor. It is not a crisis-level headline. Still, it is an unwelcome distraction at a time when HSBC is trying to project operational simplicity and focus.
Scenarios for HSBC Stock Price Direction
HSBC stock faces two distinct paths in the near term. A break above $95.14 opens the door to $96.45, while a failure at $94.04 shifts momentum to the downside.
Bullish Scenario
The bullish case rests on the strength of the daily trend structure and the fundamental tailwinds now building. If HSBC stock clears the R1 resistance at $95.14 on a closing basis, the path to the upper Bollinger Band at $96.45 opens naturally. A decisive daily close above $96.45 would represent a meaningful technical breakout. The Google AI partnership adds a longer-term revenue narrative that could draw institutional interest. Meanwhile, the dividend signal provides floor support for income-focused investors. Further clarity on the IFFCO situation — particularly any signs the exposure is contained — would remove a lingering overhang.
Bearish Scenario
The bearish case is not the dominant thesis, but it carries real weight if certain conditions materialize. A failure to hold above the daily S1 at $94.04 would shift near-term momentum to the downside. Below that, the daily EMA20 at $91.72 is the more critical structural support. A break of that level on sustained volume would challenge the entire bullish regime reading. The IFFCO credit exposure could amplify downside if the situation deteriorates or further exposure details emerge. Additionally, if the 1-hour RSI tips into overbought territory and reverses sharply, the 15-minute exhaustion could escalate into a multi-session pullback.
HSBC Stock Positioning and Outlook
Overall, HSBC stock remains in a structurally bullish daily trend with solid EMA alignment and a supportive fundamental backdrop. The near-term setup, however, is one of consolidation rather than immediate continuation. The daily MACD’s razor-thin cross suggests digestion is needed before further upside. The hourly RSI near overbought and the 15-minute momentum turn reinforce this cautious near-term view.
Volatility, as measured by the daily ATR of $2.49, leaves meaningful room for intraday swings. The $94.04–$95.14 range is the key battleground to watch. Until HSBC stock breaks decisively from that zone in either direction, positioning should be calibrated to the risk of a range-bound session. The larger trend still points firmly higher over a multi-week horizon.
FAQ
What is the current trend for HSBC stock?
HSBC stock is in a structurally bullish daily trend, trading above its EMA20 ($91.72), EMA50 ($90.26), and EMA200 ($80.87), with all three moving averages stacked in bullish alignment. The daily RSI at 57.23 confirms constructive momentum with further room to run.
What are the key support and resistance levels?
Near-term resistance sits at $95.14 (R1 pivot), with the upper Bollinger Band at $96.45 acting as a secondary ceiling. Key support levels are $94.04 (S1 pivot) and the daily EMA20 at $91.72, which serves as the more critical structural floor.
Is short-term momentum still bullish?
Short-term momentum shows signs of fading. The 15-minute MACD has turned negative and the hourly RSI at 67.02 is approaching overbought territory. These signals suggest consolidation may precede the next leg higher, even as the daily trend remains intact.
What fundamental factors are influencing HSBC stock?
Two key positive catalysts are the Google Cloud AI partnership targeting over $100 million in revenue or savings, and the confirmed $0.10 per share interim dividend for 2026. A potential headwind is the $400 million credit exposure to IFFCO Group, which adds a degree of credit risk worth monitoring.
Disclaimer: This article is for informational purposes only and does not constitute financial advice, an investment recommendation, or a solicitation to buy or sell any financial instrument or cryptocurrency. The analysis provided is not indicative of future results. Investing in crypto assets and financial markets carries a high risk of capital loss. Always do your own research (DYOR) and consult a qualified financial advisor before making any decision.
Article produced with the assistance of artificial intelligence and reviewed by the editorial team.


You May Also Like

PHL pilots green skills training for construction workers

Singapore’s MAS Adds Crypto Exchange Bybit to Investor Alert List

Death of the oldest living tortoise was just a crypto scam


