

XRP Price: Hit Its Target, Pulled Back, and Now the Bulls Need to Step Back In
TLDR
- XRP hit a ~14% breakout target from a symmetrical triangle pattern, reaching near $1.30 before pulling back
- Price is now struggling to hold above $1.21 support, with bearish momentum building on the 4-hour chart
- Analyst Ali Martinez identified the triangle setup; the pattern played out but failed to sustain gains
- Over $1.8 billion in OTC whale accumulation has been spotted, suggesting institutional interest
- Long-term triangle analysis projects potential macro targets of $6.50, $13, and $60, though these are scenario-based, not guaranteed
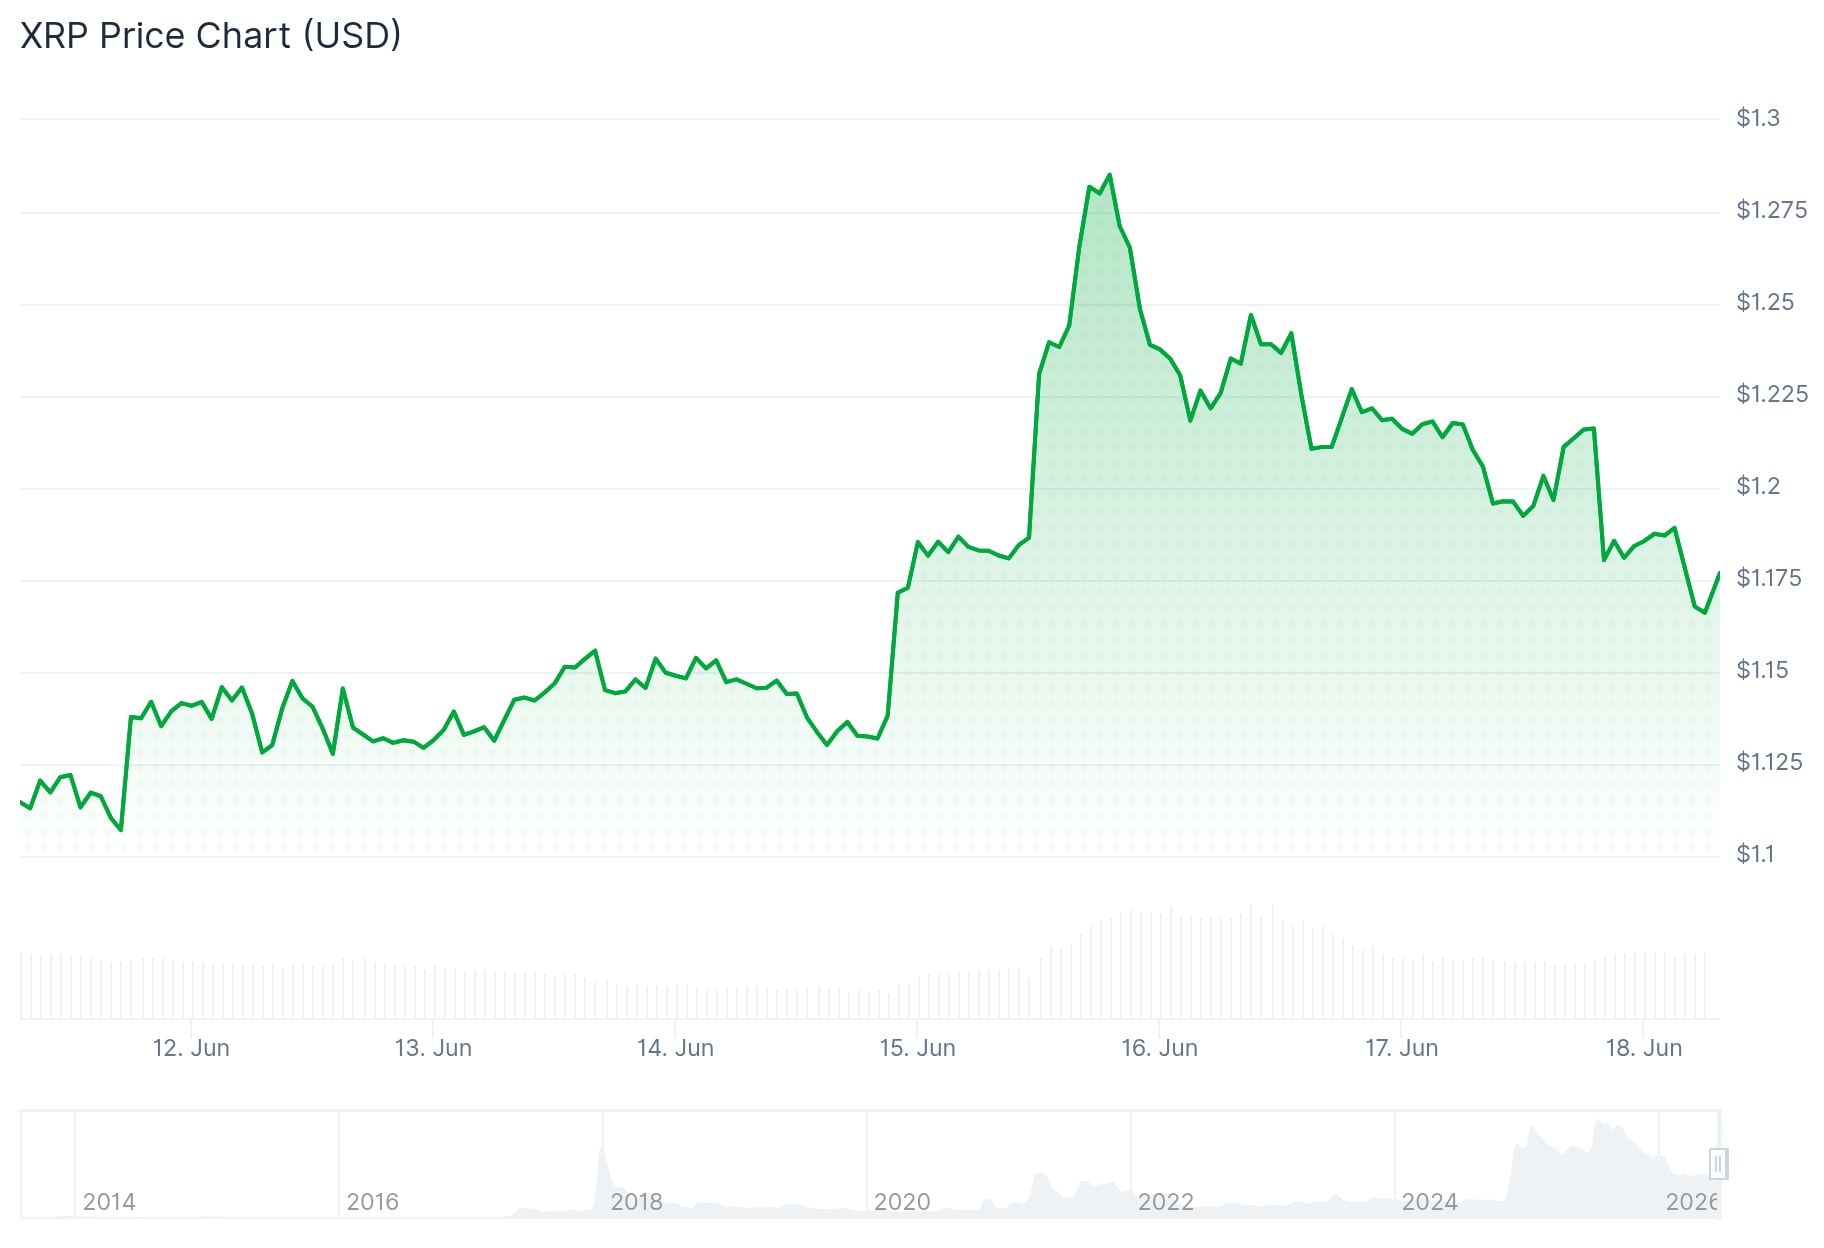
XRP is trading at around $1.21 after briefly touching $1.29 last weekend. The recent bounce failed to hold, and short-term charts are now showing bearish signals.
 XRP Price
Crypto analyst Ali Martinez flagged a symmetrical triangle formation on the XRP chart. The pattern came with a projected 14% breakout target, which was nearly reached when XRP approached $1.30. However, the price pulled back before confirming a sustained move.
The 4-hour chart shows XRP was rejected at the 78.6% retracement level at $1.298. A drop below $1.208 would add further short-term bearish pressure.
Daily trading volume has dropped by 44% in the past 24 hours. Low volume during a price stall is often a sign that buyers are not stepping in with conviction.
Bearish Pressure Builds From Technical Levels
XRP’s 7-day moving average of exchange net position change has been increasingly negative over the past three weeks. This means XRP has been flowing out of exchanges — a pattern often associated with accumulation by longer-term holders.
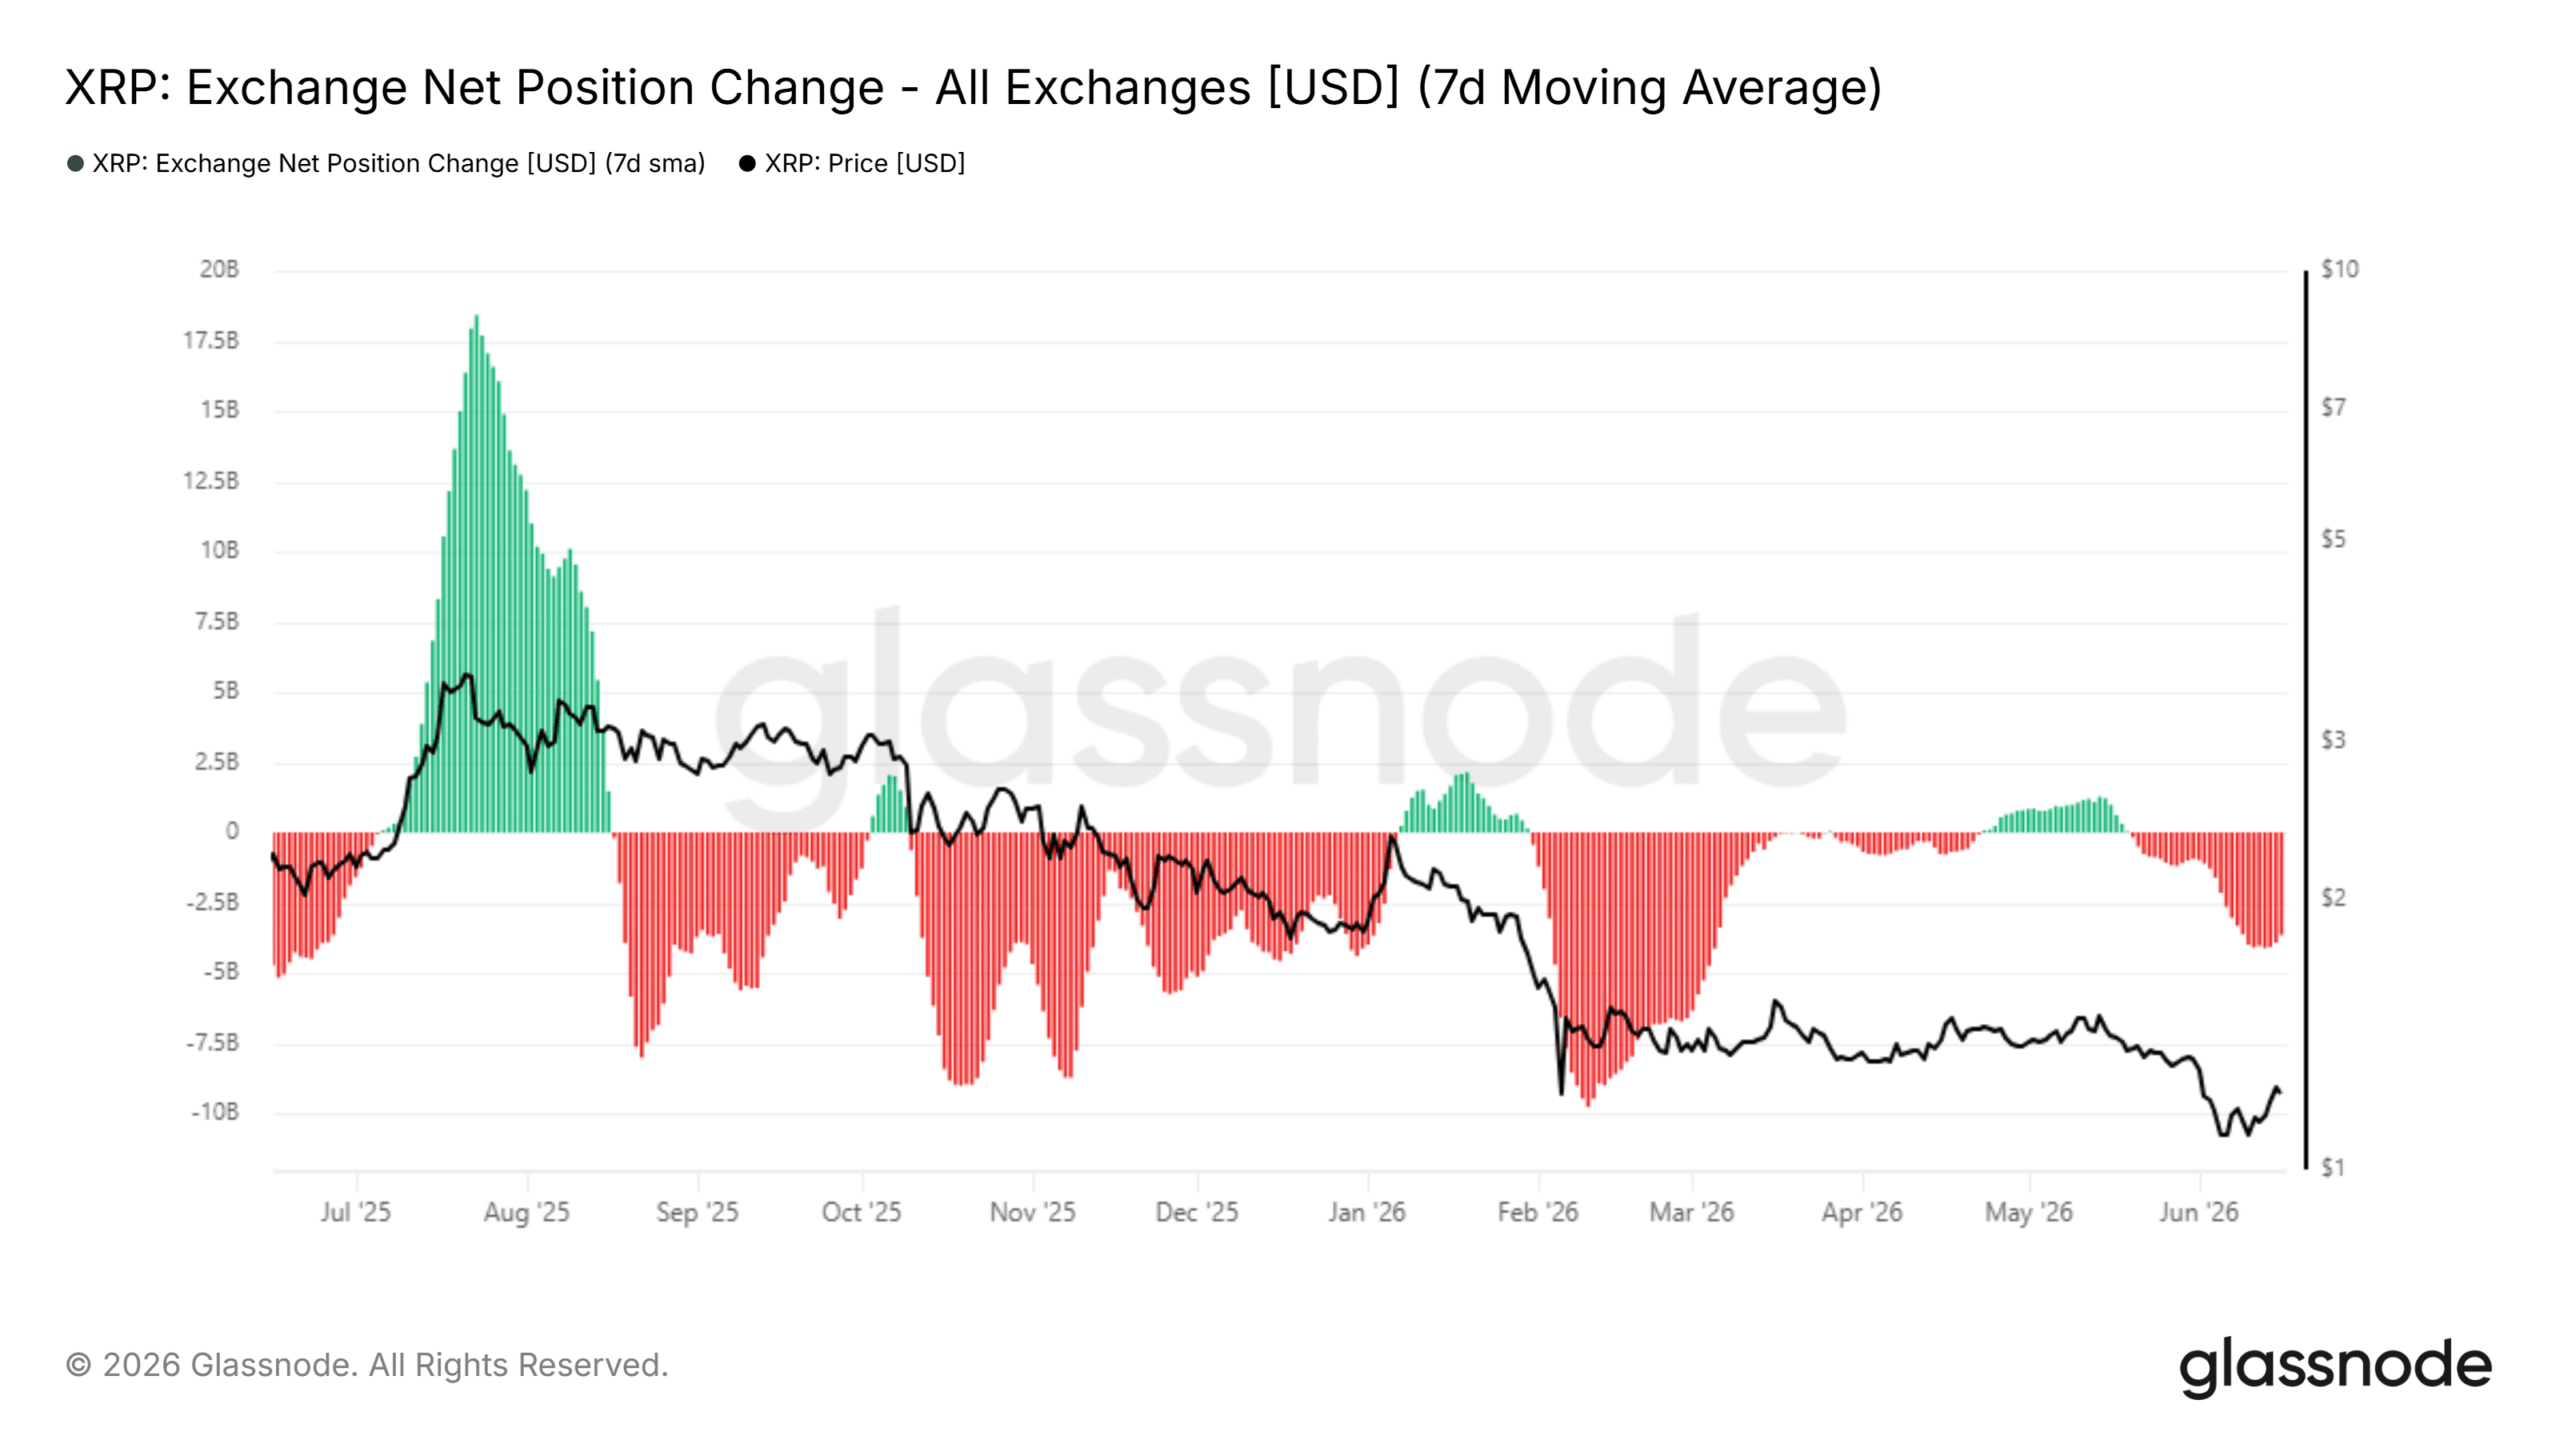 Source: Glassnode
But accumulation alone does not drive price higher. In February, heavy accumulation followed a major sell-off, yet XRP did not enter a new uptrend. Instead, it ranged and then fell further.
The bounce from $1.14 to $1.29 managed to reach only around the 50% retracement level before pulling back. For swing traders, the risk-to-reward is not favorable on the buy side. Analysts suggest using any bounce toward $1.35–$1.44 as a potential sell opportunity, with a target below $1.05.
Spot XRP ETF flows have been mostly positive this month, which adds a mild bullish counterpoint to the technical picture. Demand was concentrated on South Korean exchange Upbit though, and was not reflected evenly across other platforms.
Whale Accumulation and Long-Term Triangle
Analyst Celal Kucuker shared a post noting that the XRP chart “looks absolutely beautiful,” citing price targets of $3, $8, and $17 as achievable based on the current structure. His view reflects growing optimism among a segment of analysts despite short-term weakness.
On the macro side, analyst EGRAG CRYPTO has been tracking a long-term “big yellow triangle” structure. This framing sees XRP’s current price action as multi-cycle compression, similar to patterns seen before previous large moves. Past cycles from this structure included gains of roughly 8,000% and 1,900%.
Based on this framework, scenario-based targets include $6.50, $13, and $60. These are not price predictions — they are projections tied to specific liquidity and sentiment conditions.
Analyst Hailey LUNC XRP reported that whales have accumulated over $1.8 billion in XRP through over-the-counter trades. OTC transactions are conducted off exchanges to avoid moving the spot price, and are often used by institutional buyers.
At the time of writing, XRP trades at $1.20, with a 24-hour volume of $1.62 billion and a market cap of $74.64 billion.
The post XRP Price: Hit Its Target, Pulled Back, and Now the Bulls Need to Step Back In appeared first on CoinCentral.


You May Also Like

Moody’s Assigns First-Ever Rating to Bitcoin-Backed Municipal Bond in Historic Crypto Finance Move

Greece Shuts the Door, France Holds Binance’s EU Future

'Ominous signal' for Trump spotted as war winds down: 'What was the point of all that?'


