DOGE Price On Thin Ice As Long-Term Holders Continue to Sell
Dogecoin’s early November bounce appears weak, despite the modest 1.2% gain. DOGE price is still down 5.9% over the past week and nearly 27% this month. And now, on-chain data signals a deepening sell trend.
The key question now: can Dogecoin’s $0.17 floor— which has held strong since October 11, even during the last bearish crossover — survive as long-term holders start to exit?
Cost Basis Heatmap Marks The Last Line Of Defense
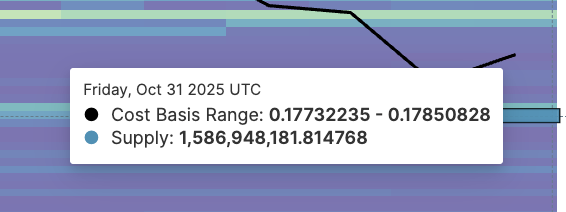
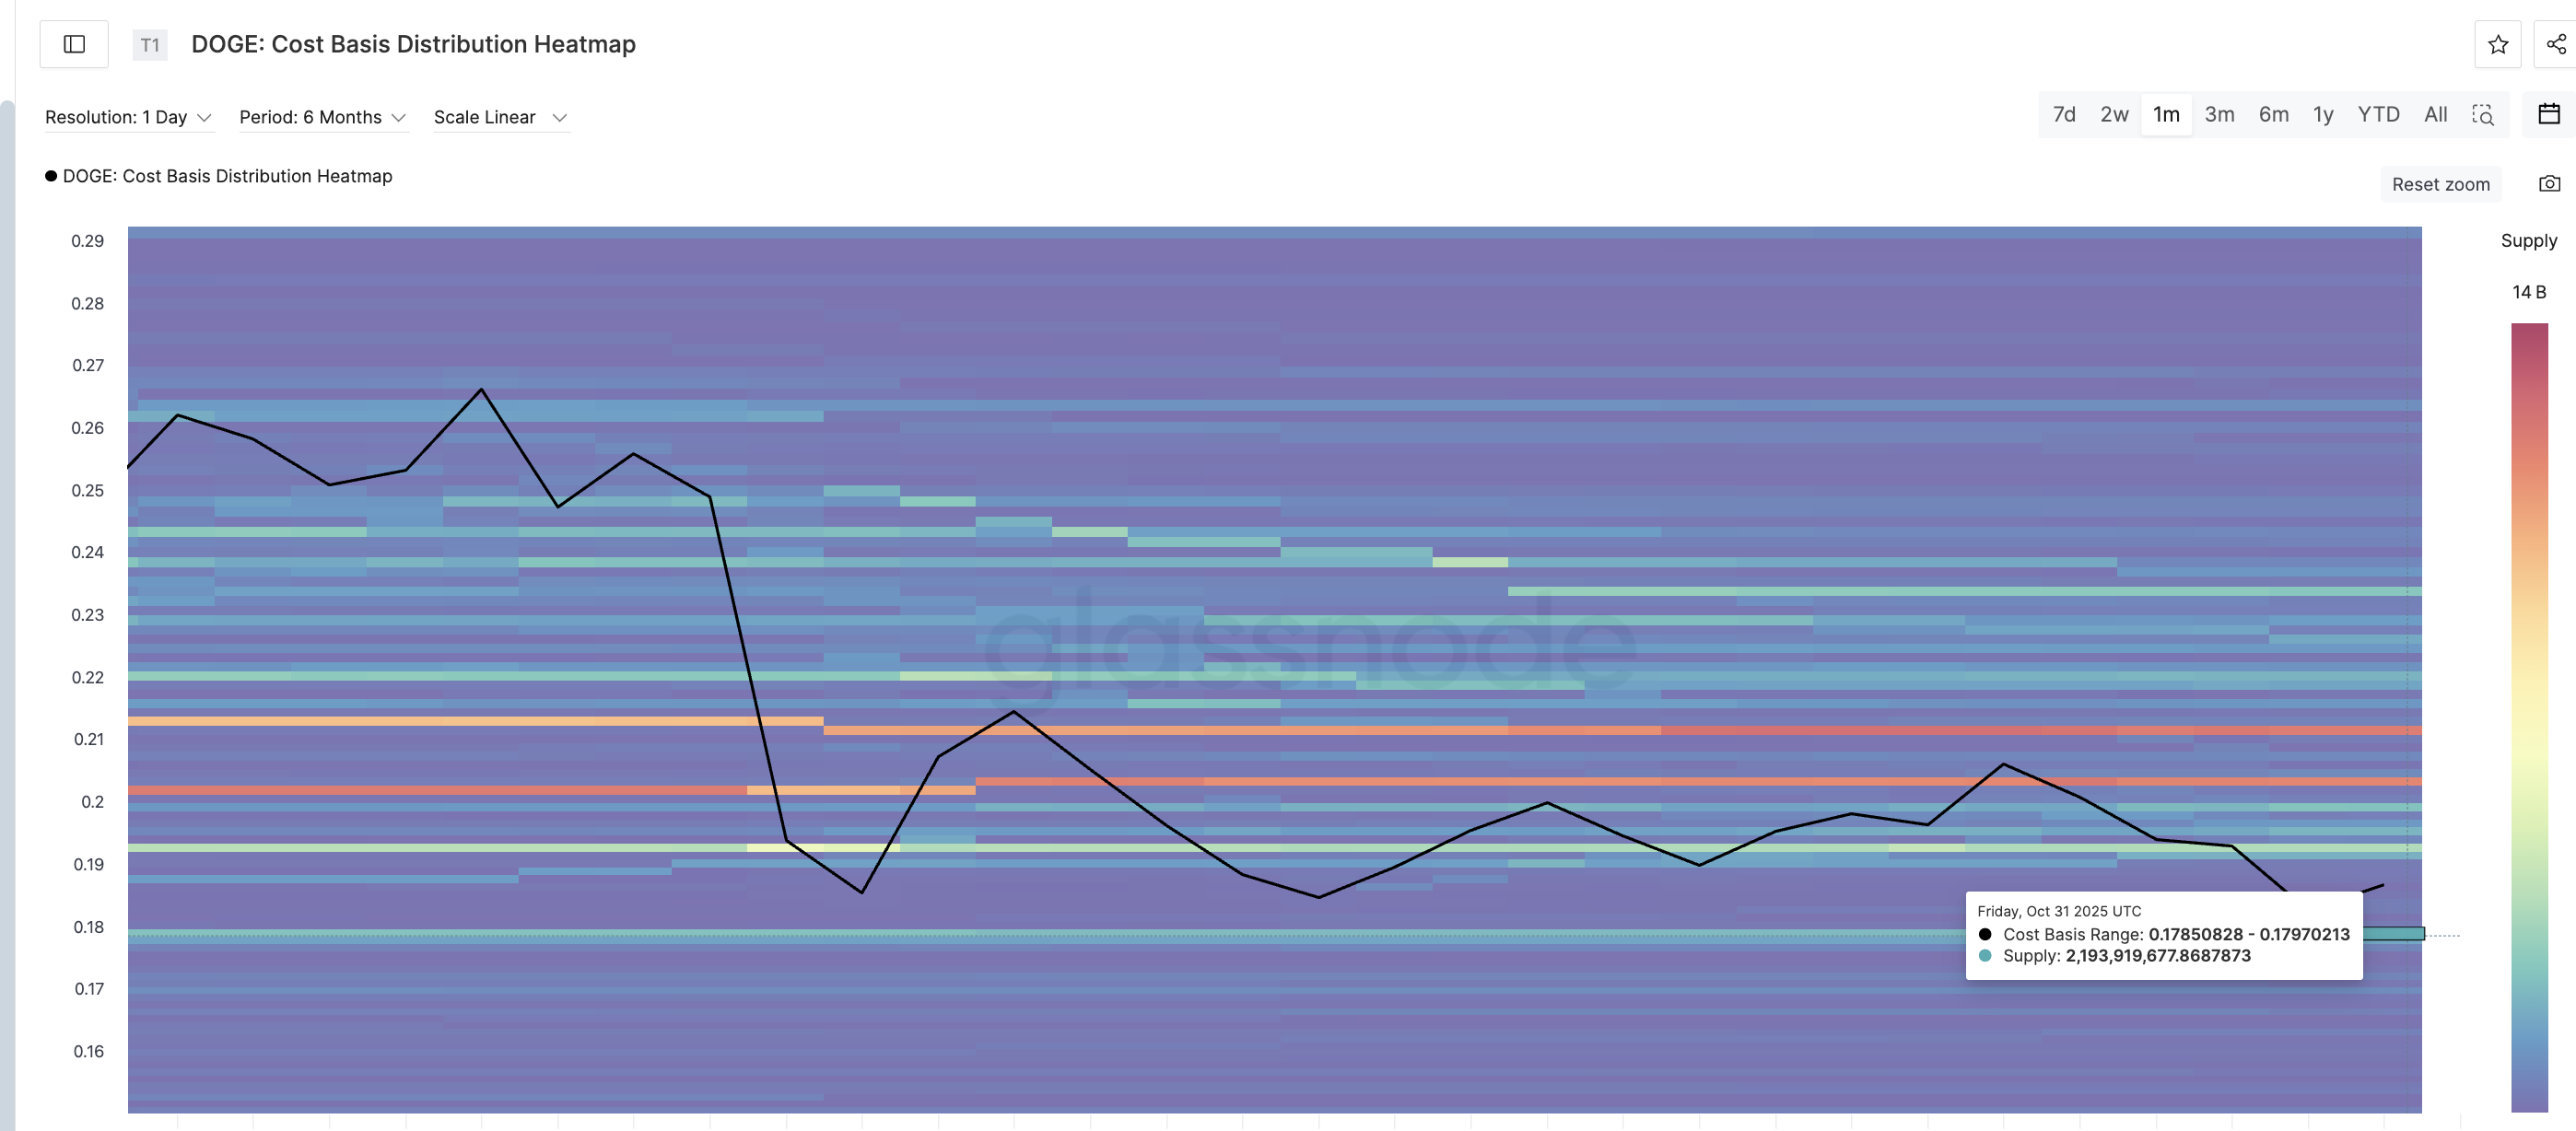
On-chain cost basis data highlights Dogecoin’s strongest short-term support cluster between $0.177 and $0.179, where nearly 3.78 billion DOGE were last accumulated.
 First Cluster Protecting The Floor: Glassnode
This range represents the heaviest long-term holder supply, acting as a key buffer during past sell-offs.
Want more token insights like this? Sign up for Editor Harsh Notariya’s Daily Crypto Newsletter here.
The cost basis heatmap shows where most investors last bought their tokens. It highlights the price zones with heavy long-term holder concentration that act as support or resistance.
 Bigger Dogecoin Support Cluster: Glassnode
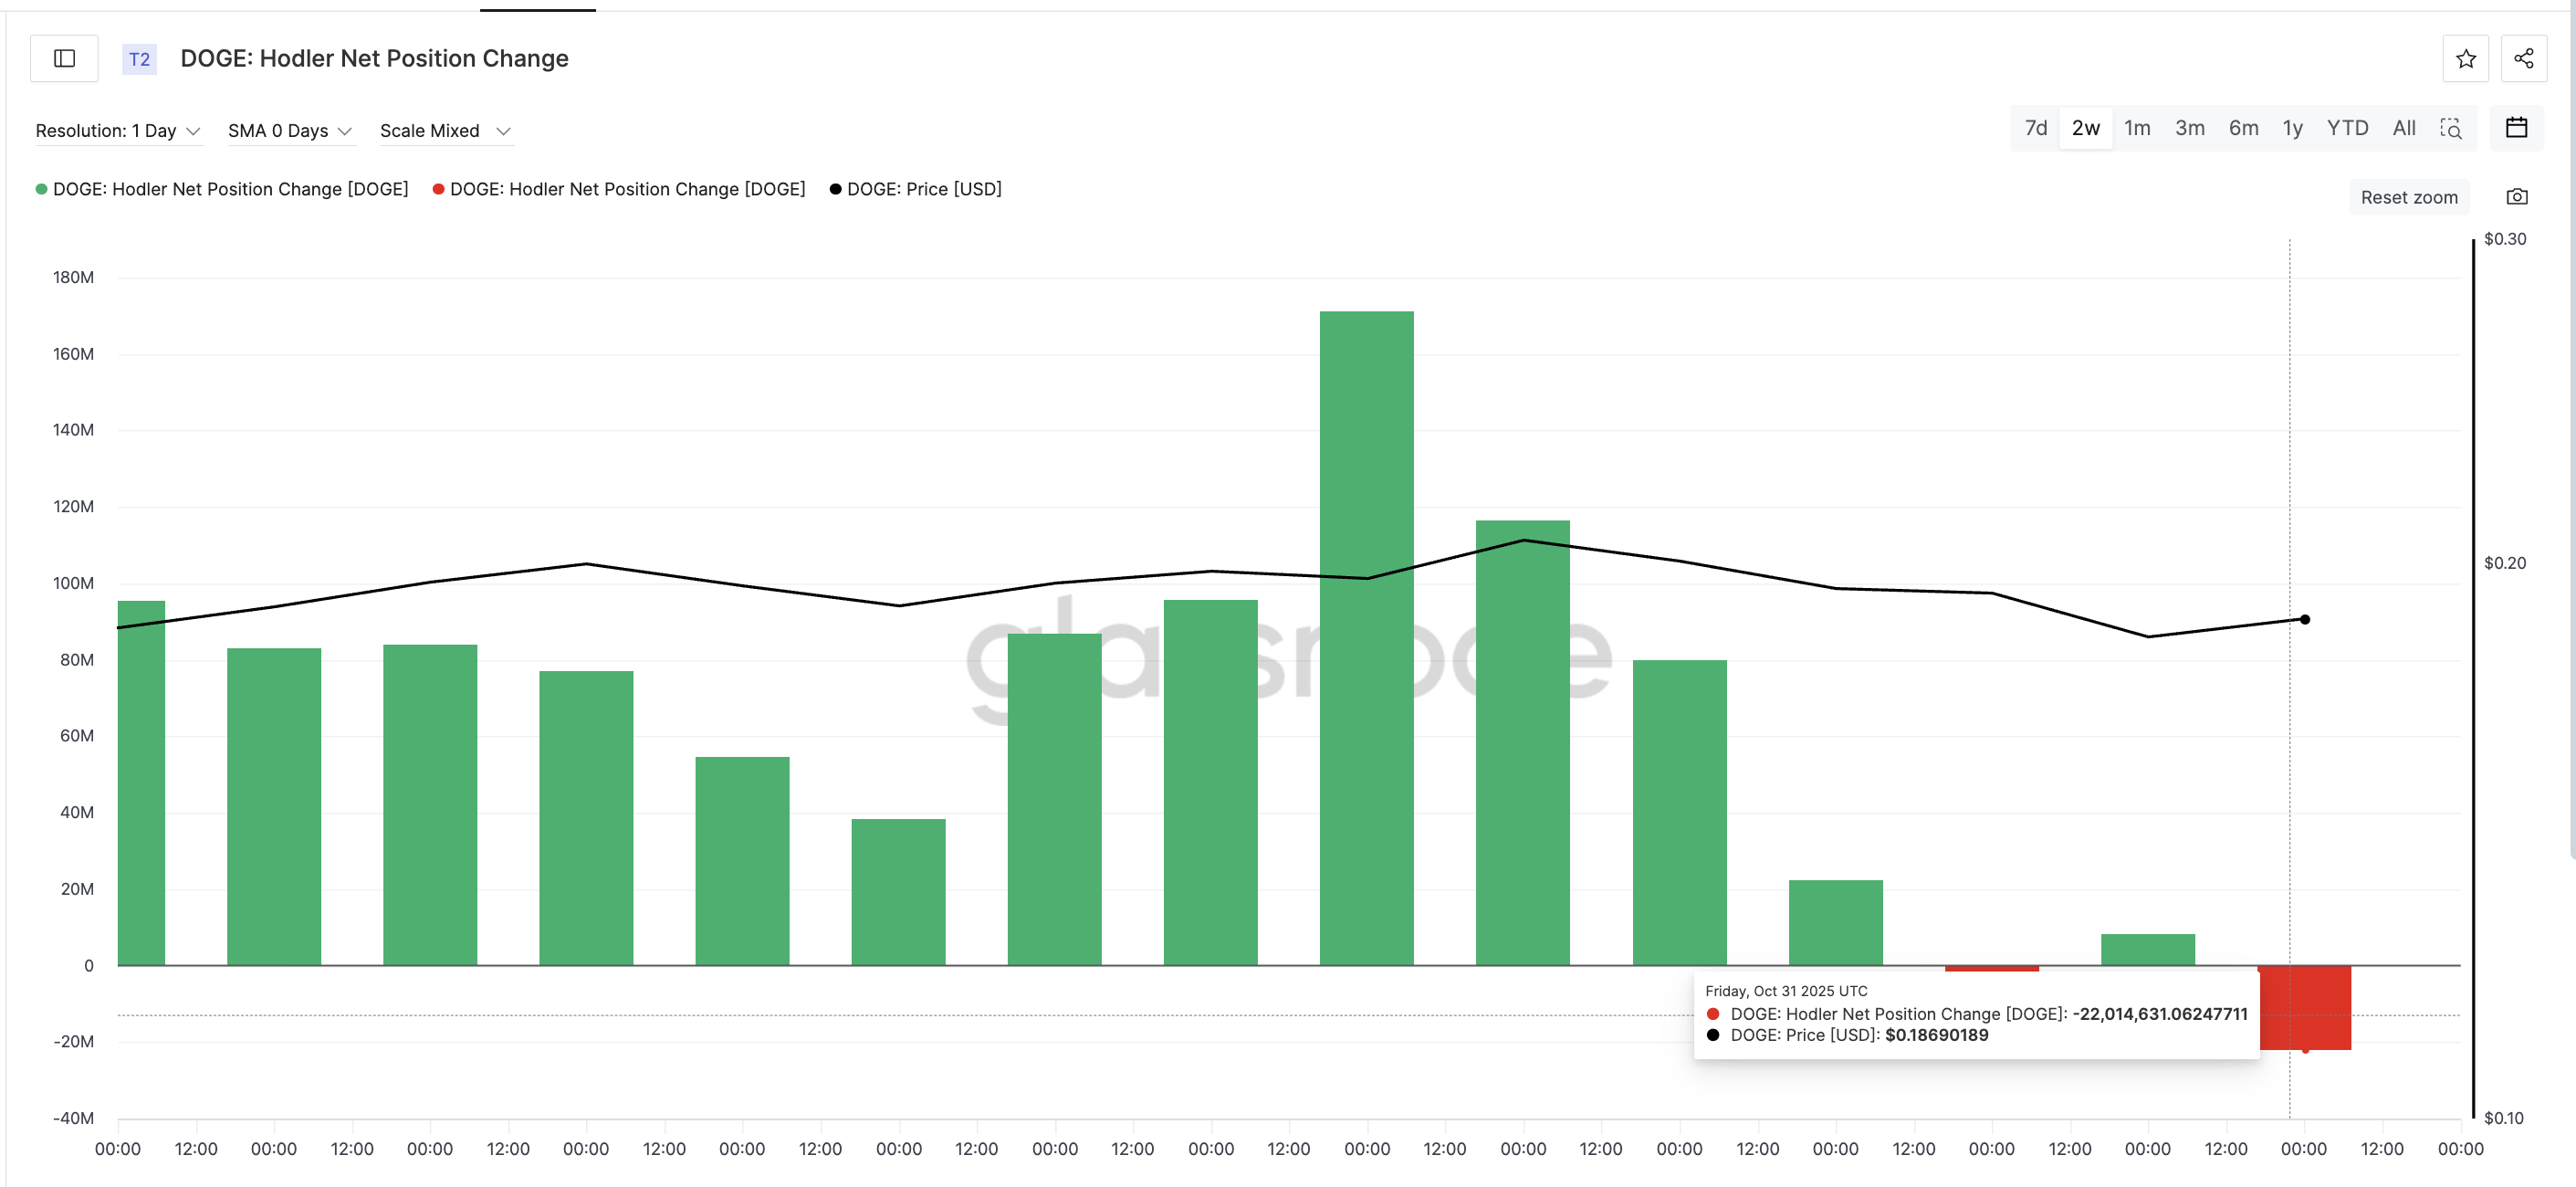
That buffer is weakening fast. According to Glassnode, Hodler Net Position Change — which tracks whether long-term wallets are adding or selling — flipped sharply negative on October 31. It dropped from an inflow of +8.2 million DOGE to an outflow of –22 million DOGE in just 24 hours. That’s a 367% reversal in holder behavior.
 Long-Term DOGE Holders Keep Selling: Glassnode
This swing confirms that even older wallets are offloading their holdings. If this continues, it could thin out the $0.177–$0.179 cluster and expose Dogecoin’s strongest base since early October to further downside risk.
Below $0.17, the next significant cost-basis cluster doesn’t appear until $0.14, leaving a wide gap for potential losses. But more on that in the next section.
Looming Death Cross Could Accelerate the DOGE Price Breakdown
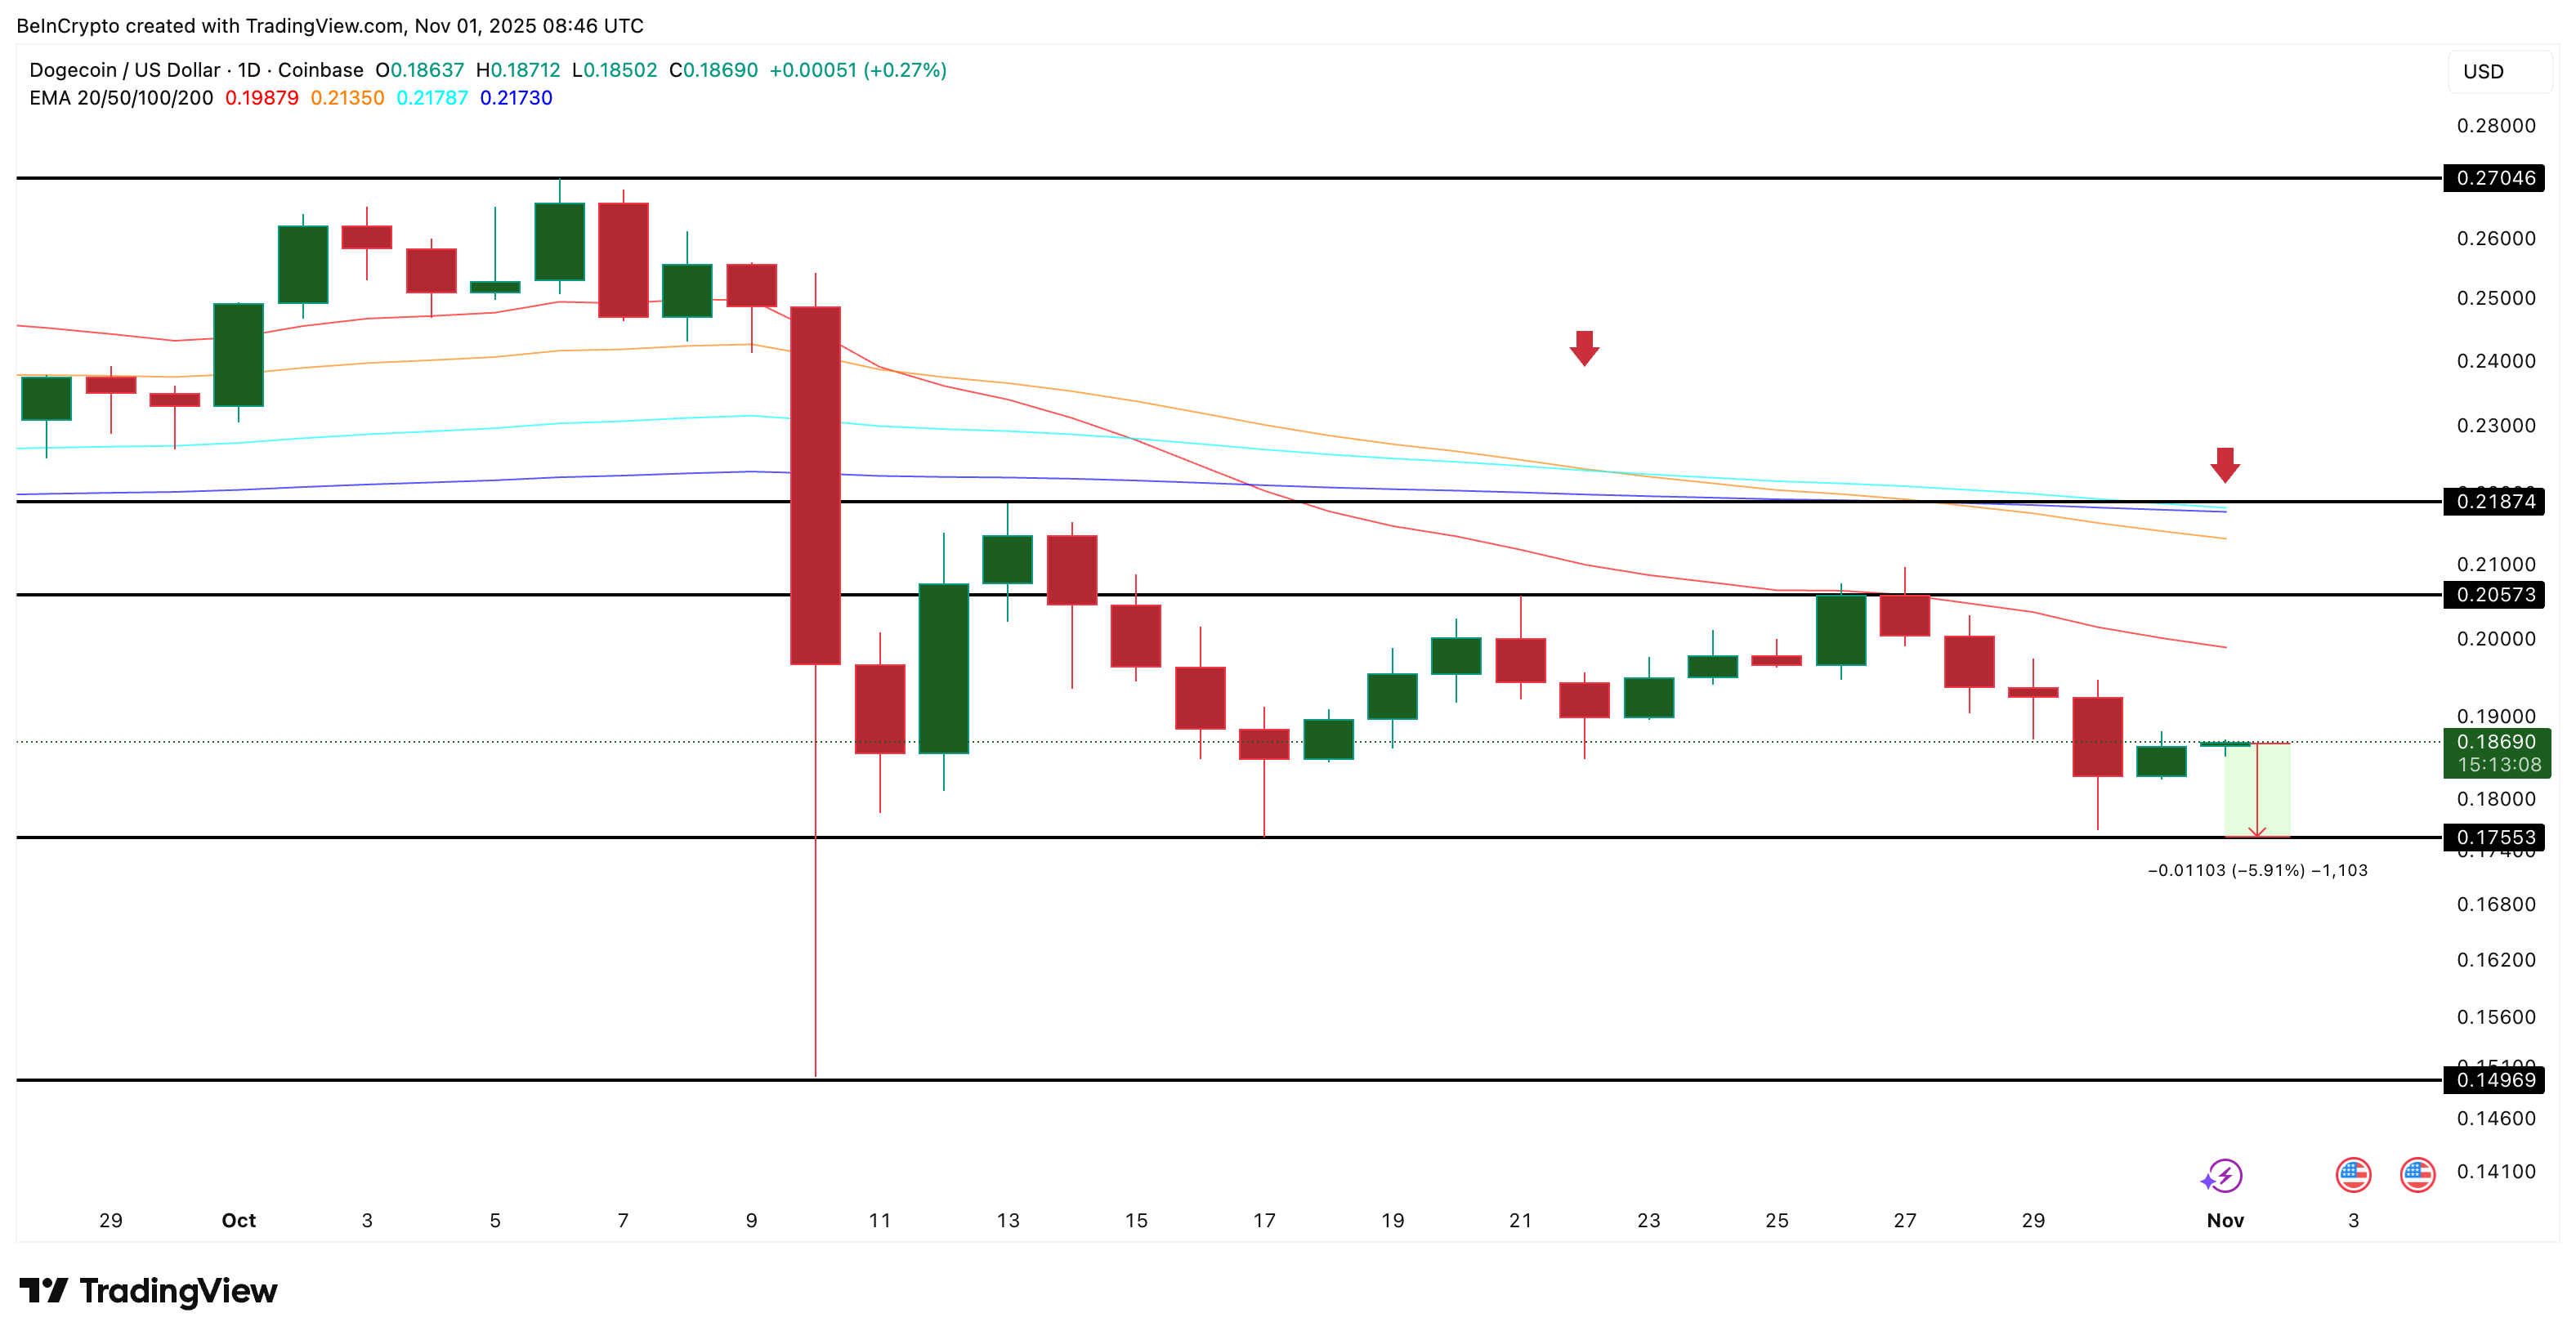
The DOGE price structure now reinforces the bearish on-chain story. After the 50-day exponential moving average (EMA) crossed below the 200-day EMA in late October, Dogecoin extended its decline — marking the first leg of its current downtrend. The EMA is a trend indicator that smooths out price data to show market direction.
Now, a second, stronger death cross is forming as the 100-day EMA approaches a drop below the 200-day EMA. Unlike the earlier crossover, this one carries more weight because both averages represent longer timeframes, reflecting sustained weakness rather than short-term volatility.
If this crossover confirms, it would signal deepening downside momentum and strengthen the bearish structure already in place. In that case, Dogecoin’s strongest support zone near $0.17, highlighted by its cost basis heatmap, could finally give way — opening the door to a fall toward $0.14. That would be a near 6% dip.
 DOGE Price Analysis: TradingView
Currently, DOGE trades near $0.18, capped by immediate resistances at $0.20 and $0.21. A daily close above $0.21, which hasn’t been tested since October 13, would be needed to invalidate this bearish bias.


You May Also Like

USD/CAD Plummets: Greenback Weakness Meets Tame Canadian Inflation Data

Stablecoin Privacy Emerges as Top Barrier to Institutional Blockchain Adoption