This section offers crucial empirical proof that Transformers cling to statistical short cuts rather than learning true reasoning algorithms from data. Graph connection tasks are used by the authors to illustrate this. Upon training on typical random graphs, a model rapidly reaches an accuracy of about 80%. Further research, however, shows that it does not learn pathfinding; instead, it just predicts "connected" by default and occasionally predicts "not connected" using a rudimentary heuristic that involves determining if the source or target node has a degree of zero.This section offers crucial empirical proof that Transformers cling to statistical short cuts rather than learning true reasoning algorithms from data. Graph connection tasks are used by the authors to illustrate this. Upon training on typical random graphs, a model rapidly reaches an accuracy of about 80%. Further research, however, shows that it does not learn pathfinding; instead, it just predicts "connected" by default and occasionally predicts "not connected" using a rudimentary heuristic that involves determining if the source or target node has a degree of zero.

Does Progressive Training Improve Neural Network Reasoning Ability?

2025/11/05 18:30
10 min read
For feedback or concerns regarding this content, please contact us at crypto.news@mexc.com

Abstract and 1. Introduction

1.1 Syllogisms composition

1.2 Hardness of long compositions

1.3 Hardness of global reasoning

1.4 Our contributions

  1. Results on the local reasoning barrier

    2.1 Defining locality and auto-regressive locality

    2.2 Transformers require low locality: formal results

    2.3 Agnostic scratchpads cannot break the locality

  2. Scratchpads to break the locality

    3.1 Educated scratchpad

    3.2 Inductive Scratchpads

  3. Conclusion, Acknowledgments, and References

A. Further related literature

B. Additional experiments

C. Experiment and implementation details

D. Proof of Theorem 1

E. Comment on Lemma 1

F. Discussion on circuit complexity connections

G. More experiments with ChatGPT

B Additional experiments

B.1 Implications on random graphs

Here, we further discuss the disadvantages of using random graphs as the graph distribution for the implications task. There are two main downsides to using random graphs distribution instead of the cycle task distribution (Definition 1):

\

  1. The distance between nodes (i.e., the number of statements to compose) does not scale well with the number of nodes/edges in the graph.

    \

  2. Whether two nodes are connected or not often correlates with low-complexity patterns such as the degree of the nodes in random graphs, thus, weak learning on random graphs does not necessarily imply that the model has truly learned to find a path between two nodes. In other words, the model may be able to rely on shortcuts instead of solving the composition task.

\ In this section, we provide empirical evidence for both of the claims above.

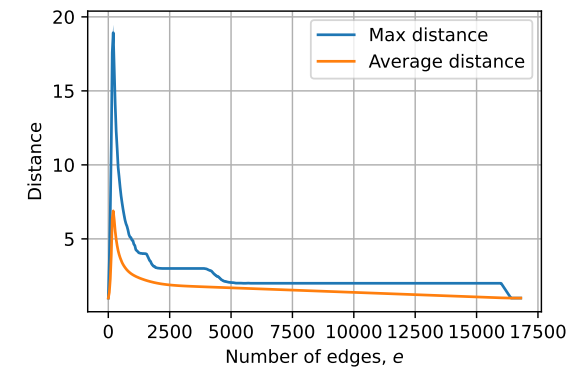
\ First, we consider random graphs with n nodes and a varying number of edges e. For each pair of (n, e), we compute the average of maximum distance and the average of the average distance in random graphs with n nodes and e edges. (We ignore the nodes that are not connected.) The results for n = 128 are presented in Figure 6. It can be seen that the distances in the graphs do not scale well with the number of nodes and edges in the graph. (E.g., compare this to having distance n in the cycle task with 2n nodes/edges.) This is because a high number of edges usually results in a very well-connected graph and a low number of edges leads to mostly isolated edges.

\ Now, we move to the second claim, i.e., the model using low-complexity patterns and correlations. As an example, we take random graphs with 24 nodes and 24 edges. In order to have a balanced dataset with samples of mixed difficulties, we create the dataset as follows. We first sample a random graph with 24 nodes and edges. Then with probability 0.5 we select two nodes that are not in the same connected component (label 0) and with probability 0.5 we choose a distance d ∈ {1, 2, 3, 4} uniformly and we choose two nodes

\ Figure 6: The average of the maximum and average distance in directed random graphs with n = 128 nodes and a varying number of edges.

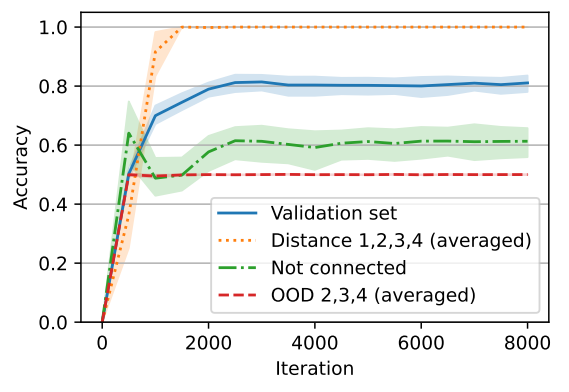
\ that have distance d (if the graph does not have any two nodes with distance d, we sample another random graph). As a result, our dataset is balanced and 12.5% of the samples have distance d for d ∈ {1, 2, 3, 4}. We trained our model on this dataset and we observed that the model reaches an average accuracy of roughly 80%. The results are shown in Figure 7. More precisely, we observed that the model has perfect accuracy when the two nodes are connected (there is a path), and has around 60% accuracy when the two nodes are not connected (the nodes are not in one connected component). In other words, the default behavior of the model is to say that the nodes are connected and the model can also detect that two nodes are not connected in 60% of the cases.

\ To further test whether the model is truly understanding that the two nodes are not connected or it is only relying on low-complexity correlations, we designed new data distributions and assessed the model’s behavior on these new distributions. The samples in the new distributions also have 24 nodes and edges so the model does not have a length generalization problem. More specifically, for i ∈ {2, 3, 4}, we designed distribution OOD i such that each dataset is balanced and for each sample, the two nodes are either in a cycle of size 2i with distance i or they are in two disjoint cycles of size i. All the other nodes are also in different cycles.[11] Note that these distributions are motivated by the cycle task. For example, it is not possible for the model to merely rely on the degree of the nodes. However, if the model uses the correct algorithm (i.e., tries to find a path) then the number of reasoning steps (e.g., length of the BFS/DFS search) is i as the distance between the nodes is i when they are connected and otherwise they are connected exactly to i − 1 other nodes. As it can be seen in Figure 7, the model has 50% (random) accuracy on these distributions meaning that it is not really checking whether there is a path between two nodes or not, even for simple examples in OOD 2 supporting that the model is relying on correlations rather than finding a path. (In particular, the model always outputs connected on these OOD datasets.)

\ We tried to further understand the behavior of this model. By sampling, we computed that one can get an accuracy of around 82% on in-distribution samples just by outputting not-connected if the out-degree of the source query node or the in-degree of the destination query node is zero and connected otherwise. Further, we noticed that this predictor has a high correlation with the output of the model. In particular, in almost all of the cases that the model predicts not-connected, the source’s out-degree or the destination’s in-degree is zero. (The model may still misclassify some of such samples depending on the random seed.) The latter shows that the model is indeed relying on the degrees of the query nodes as a shortcut.

\ Figure 7: Performance of a model trained on a balanced distribution of random graphs with 24 nodes and edges where with probability 0.5 the query nodes are not connected and with probability 0.5 they are connected and their distance is uniformly selected from 1, 2, 3, 4. The validation set has the same distribution as the training set showing that the model reaches around 80% accuracy on in-distribution samples. Particularly, the model has perfect accuracy on connected nodes (distance 1-4) and around 60% accuracy on the nodes that are not connected. However, when we tested the model on OOD samples (where some spurious correlations are not present) the model shows a chance level performance. Note that these samples would be of low complexity if the model was actually checking whether there exists a path or not.

\

B.2 Change of distribution and curriculum learning

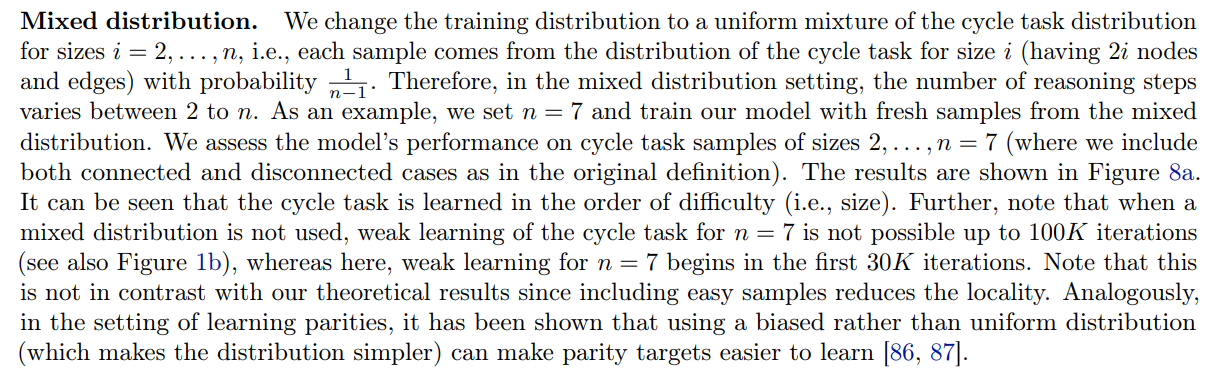
We have defined the cycle task such that all samples in the dataset have the same difficulty. More specifically, if the two nodes are connected their distance is n and if they are not connected they are each in a cycle with n vertices. Thus, it is a natural question to ask what would happen if the training distribution included samples of varying difficulties. To investigate the answer to this question, we use a distribution with samples of mixed difficulties for the training. Furthermore, we try curriculum learning [85] by increasing the samples’ difficulty throughout the training.

\

\ Curriculum learning. Next, we try curriculum learning, i.e., we give samples in the order of difficulty (size in the cycle task) to the model during training. We consider two settings: (1) a setting in which the model has to fit samples of all difficulties and (2) a setting in which the model is allowed to forget easier samples. In other words, in the first setting, we want the model to fit cycle task samples of sizes 2, . . . , n while in the second setting, we only care about fitting samples of size n. We start with the first setting which is closer to

\ Figure 8: Accuracy for cycle tasks of varying sizes where a mixed distribution (left) and curriculum learning (right) have been used during training. It can be seen that using both a mixed distribution of samples with different difficulties and curriculum learning can reduce the learning time.

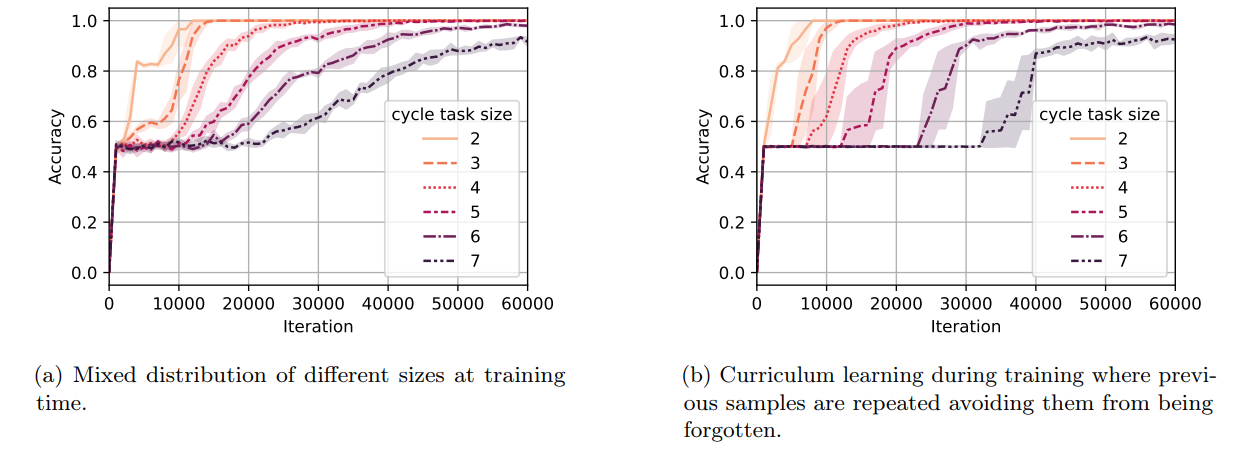
\ the notion of mixed distribution above. We consider distributions D2, . . . , Dn such that distribution Di is a uniform mixture of cycle task samples of sizes 2, 3, . . . , i (e.g., Dn is the mixed distribution used for the mixed distribution setting of Figure 8a). We start training on D2 and we change training distribution from Di to Di+1 when reaching a 95% accuracy on Di . The results for this curriculum setting are provided in Figure 8b. Comparing this curriculum setting to the use of mixed distribution without curriculum (Figure 8a), we can see that curriculum learning helps the model reach a high (e.g., 80%) accuracy slightly faster. Nevertheless, note that weak learning starts earlier in the mixed distribution setting, as the model is trained on samples of all difficulties from the beginning. The general observation that beyond using a mixed distribution, curriculum is helpful for learning has been previously shown both theoretically [88] and empirically [89].

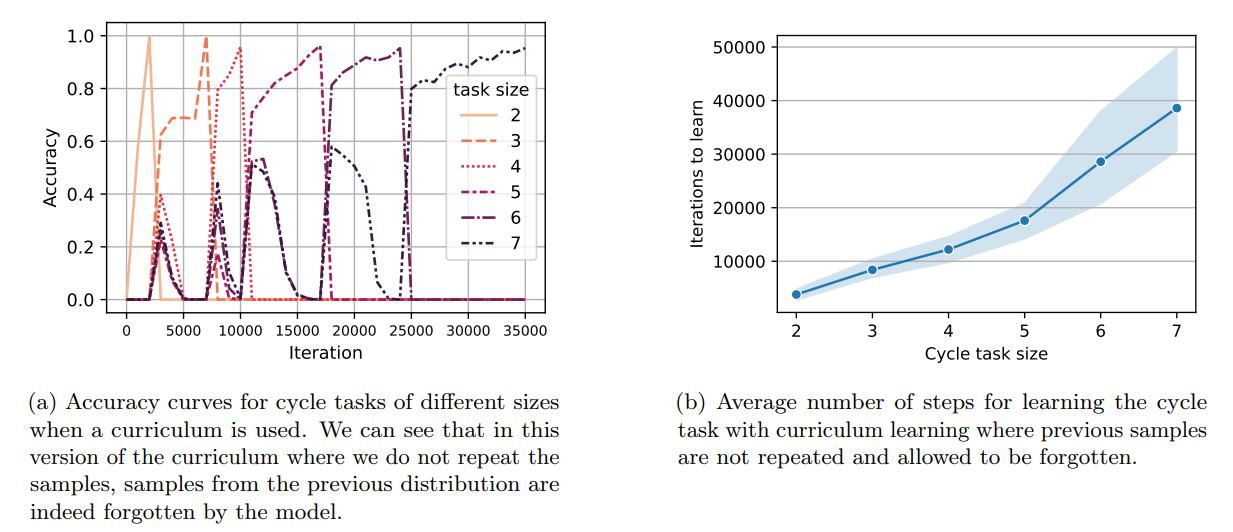
\ Now, we move to the second setting where we allow easier samples to be forgotten. More precisely, we consider distributions D2, . . . , Dn such that distribution Di is the distribution of samples of the cycle task of size i (i.e., 2i nodes and edges). Similarly, we start training on D2 and we go from Di to Di+1 when reaching a 95% accuracy on Di . We present the accuracy curves for a single random seed in Figure 9a. We further provide the average number of iterations required to reach 0.95% accuracy for the cycle task of different sizes in Figure 9b. It can be seen that the time complexity for this variant of the curriculum method is lower than the former curriculum method at the cost of forgetting samples of smaller sizes.

\ In sum, using distributions with samples of a mixed difficulty and also curriculum learning can reduce the learning complexity. (E.g., they made cycle task of size 7 learnable). Nevertheless, the scratchpad approaches are still significantly more efficient (see Figure 4a).

B.3 Learning parities with scratchpad

\ Figure 9: Curriculum learning based on sizes of the task used at training time. Here, samples of smaller sizes are allowed to be forgotten. The left plot presents accuracy for different sizes for a single run while the plot on the right presents the average number of iterations required for learning using curriculum for different sizes.

B.4 Length generalization for the parity task

\ Figure 10: Learning the half-parity function (learning the parity of the first n/2 bits from the total n bits) for different numbers of bits using a scratchpad. It can be seen that the half-parity targets can be learned efficiently as the number of bits n grows. Note that the random seed of the experiment can cause some variation in the number of iterations required for learning the parity.

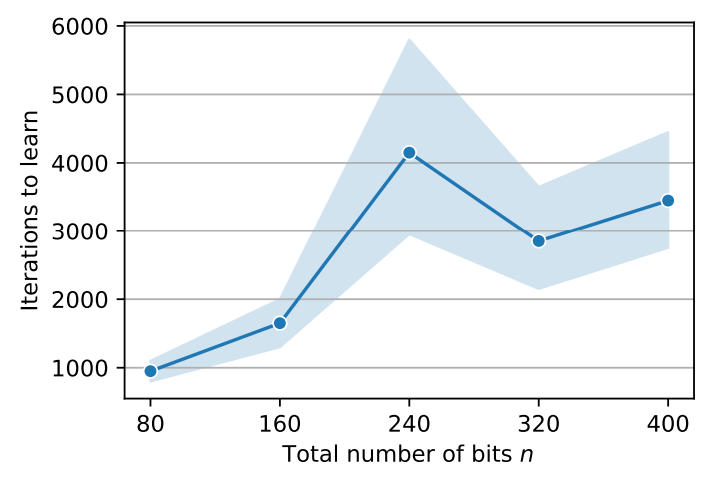
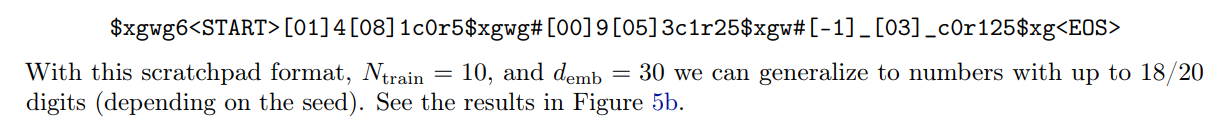
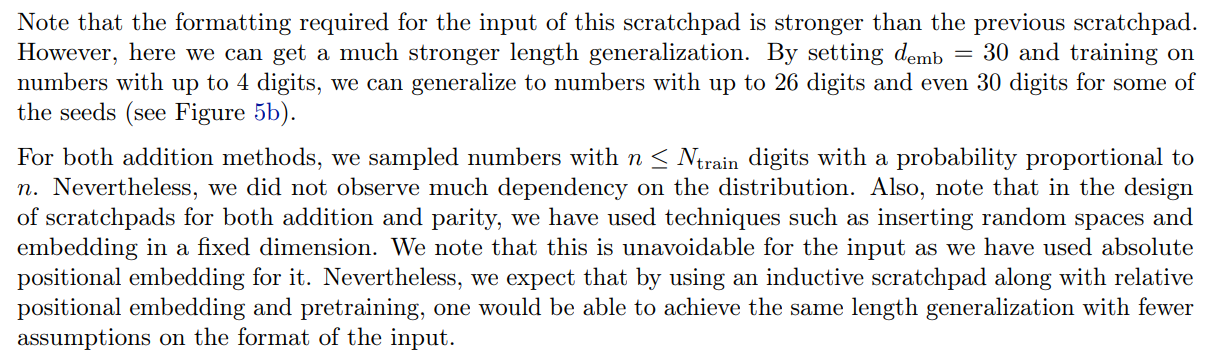
B.5 Length generalization for the addition task

\ In other words, at each iteration, we shift the ans to the right (and lose the rightmost token). Instead, we concatenate the ith digit of the summation to it from the left. So in general, the model has to increase the pointers in the scratchpad, read their corresponding values, and do one summation using them (and the carry in the previous state) at each reasoning step. The scratchpad ends when both numbers are finished. Note that the answer is always the string to the left of $ at the end of the text. Thus, the completed scratchpad for our example (where input is 94+3__1=) can be given by

\

\

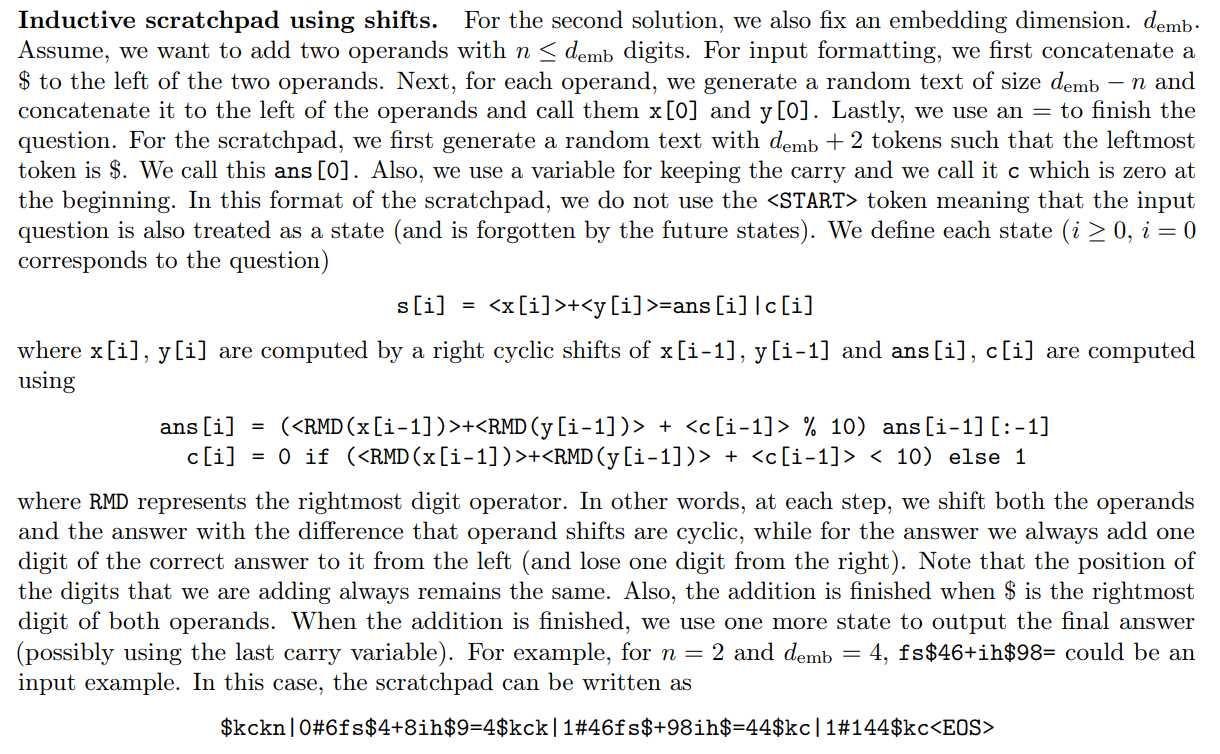
\ In the example above one can note that some part of the s[0] is in the question and some part of it is in the scratchpad.

\

\

:::info Authors:

(1) Emmanuel Abbe, Apple and EPFL;

(2) Samy Bengio, Apple;

(3) Aryo Lotf, EPFL;

(4) Colin Sandon, EPFL;

(5) Omid Saremi, Apple.

:::


:::info This paper is available on arxiv under CC BY 4.0 license.

:::

[11] For example, for i = 3, distribution OOD 3 consists of graphs with 4 cycles of size 6 where the nodes are in a single cycle and their distance is 3 and graphs with 5 cycles of sizes 3,3,6,6,6 where the query nodes are in the two cycles of size 3.

Market Opportunity
Notcoin Logo
Notcoin Price(NOT)
$0.0004225
$0.0004225$0.0004225
+6.79%
USD
Notcoin (NOT) Live Price Chart
Disclaimer: The articles reposted on this site are sourced from public platforms and are provided for informational purposes only. They do not necessarily reflect the views of MEXC. All rights remain with the original authors. If you believe any content infringes on third-party rights, please contact crypto.news@mexc.com for removal. MEXC makes no guarantees regarding the accuracy, completeness, or timeliness of the content and is not responsible for any actions taken based on the information provided. The content does not constitute financial, legal, or other professional advice, nor should it be considered a recommendation or endorsement by MEXC.

You May Also Like

DBS Tests Repo With Ripple RLUSD and Franklin sgBENJI

DBS Tests Repo With Ripple RLUSD and Franklin sgBENJI

The post DBS Tests Repo With Ripple RLUSD and Franklin sgBENJI appeared on BitcoinEthereumNews.com. Ripple, DBS, and Franklin Templeton launch tokenized repo pilot on DBS Exchange. Repo trades use Ripple’s RLUSD stablecoin and Franklin Templeton’s sgBENJI token. sgBENJI issued on XRP Ledger enables fast collateralized lending and settlements. DBS, Ripple, and Franklin Templeton have signed a memorandum of understanding to bring repo transactions into tokenized finance. The framework pairs Ripple’s RLUSD stablecoin with Franklin Templeton’s sgBENJI tokenized money market fund, listed on DBS Digital Exchange. The setup gives accredited clients a path to rebalance cash into a regulated, yield-bearing vehicle while transacting with stablecoins that settle within minutes. For institutions used to overnight repo desks, this is a first look at how traditional liquidity tools can migrate onto public blockchains. Related: Franklin Templeton Launches its DeFi Solution Benji on Ethereum Demand From Institutions Shapes the Design The three firms cited rising demand for digital asset allocations, with surveys showing nearly nine in ten institutional investors plan to increase exposure in 2025. The repo model was chosen because it mirrors an existing backbone of global funding markets: collateralized lending against short-term securities. By allowing RLUSD to trade directly against sgBENJI on DBS Digital Exchange, desks can manage intraday liquidity, park stablecoin reserves into a fund earning regulated yield, and unwind positions quickly when cash is needed. DBS to Expand Collateralized Lending The next phase extends sgBENJI beyond a trading instrument into repo collateral. DBS plans to let investors pledge sgBENJI against credit lines arranged through the bank or third-party lenders. That opens deeper liquidity pools with the assurance that collateral sits inside a regulated balance sheet. For trading desks, that means onchain repo could eventually function like its traditional counterpart, rolling positions overnight, secured by tokenized assets that settle in near real-time. XRP Ledger as the Settlement Rail Franklin Templeton will issue sgBENJI tokens on…
Share
BitcoinEthereumNews2025/09/18 20:25
Pepeto Attracts Capital As Early Shiba Inu And Pepe Investors Hunt Big Gains And The Next 100x Story

Pepeto Attracts Capital As Early Shiba Inu And Pepe Investors Hunt Big Gains And The Next 100x Story

The post Pepeto Attracts Capital As Early Shiba Inu And Pepe Investors Hunt Big Gains And The Next 100x Story appeared first on Coinpedia Fintech News Early Shiba Inu and PEPE stories are legendary. Some first movers turned $1,000 into well over $1,000,000 as SHIB ran more than 26,000% in 2021, while PEPE delivered multi-thousand % bursts for the earliest entries. After riding those arcs, many of those holders are hunting the next big move, shifting from SHIB to PEPE and …
Share
CoinPedia2025/09/18 19:02
A 3821% surge in 20 years: Why are Pokémon cards valuable investments?

A 3821% surge in 20 years: Why are Pokémon cards valuable investments?

By David Unyime Nkanta Compiled by: TechFlow The Pokémon trading card game is extremely popular around the world, especially in Japan. These cards are very valuable, especially the rare ones. (Image source: Twitter / FADA Pack Magic @FadaPackMagic) Pokémon trading cards have gone from amusement park items to one of the world's hottest alternative investments. According to data from analytics firm Card Ladder, the Pokémon card market has grown 3,821% in value since 2004, far outpacing the S&P 500's 483% increase and Meta Platforms' 1,844% growth. From hobby to high-yield asset Pokémon trading cards, launched by Nintendo in 1996, have become a popular investment, traded across platforms including eBay, TCGplayer, and international expos. The market has seen explosive growth during the pandemic, as stimulus policies and lockdowns have driven collectors toward alternative assets. For some, the investment has yielded life-changing returns. Lucas Shaw, a 27-year-old account manager in Ohio, said the profits from selling the cards helped him pay for his wedding rings and celebrations. Similarly, Justin Wilson, a 32-year-old advertising manager in Oklahoma City, estimates the total value of his collection of 500 cards and 100 sealed items at about $100,000. He considers Pokémon cards part of his investment portfolio, alongside his Roth IRA and securities accounts. The appeal of Pokémon cards lies not only in financial gain but also in their emotional resonance. "You have to collect them all," Wilson said, referencing the series's classic slogan. For many, the cards represent both childhood nostalgia and speculative opportunity. Where does the value of rare Pokémon cards come from? A classic Poké Ball toy with matching Pokémon trading cards. Zapdos, Ninetales, and a trainer card are clearly visible. Image credit: Thimo Pedersen/Unsplash Unlike stocks, Pokémon cards don't generate dividends; their value depends on their rarity, condition, and cultural significance. Cards graded as perfect PSA 10 by the Professional Sports Authenticator (PSA) often fetch exorbitant prices. The most dramatic example occurred in 2022, when influencer Logan Paul purchased a near-perfect "Pikachu Illustrator" card for $5.3 million, setting a Guinness World Record for the most expensive Pokémon card ever sold privately. This event further ignited market interest and highlighted the speculative potential of high-level cards. Risks of the Pokémon Card Market Financial advisors warn against considering collectibles as the core of a portfolio. Card prices are extremely volatile, influenced by hype, media coverage, and collector sentiment. Counterfeit cards also remain a potential threat, with scams frequently occurring. Image source: Flickr/c0rnnibblets Still, the resilience of the Pokémon brand provides some stability to the market. Pokémon spans video games, movies, and merchandise, and unlike sports trading cards, the characters are immune to scandals, making them a safer investment for some collectors. The Future of Collectibles Investing The rapid rise of Pokémon cards reflects a broader shift in people's perception of value. As digital assets like Bitcoin face regulatory scrutiny and tech stocks undergo a market correction, tangible collectibles offer a nostalgic and potentially profitable haven. While the sustainability of its value remains uncertain, the 3,821% growth over the past 20 years has established Pokémon trading cards as the most vivid example of how a childhood hobby can transform into a multi-million dollar investment.
Share
PANews2025/09/18 18:00