Why might the "four-year cycle theory" be wrong? Using Bayes' theorem to calculate market risk at the end of 2025.
Author: NingNing
By 2025, we had experienced less than four complete four-year cycles. However, basic statistical knowledge tells us that any conclusions drawn from extremely small statistical sample sizes (only three valid data points) require careful verification, rather than simple blind faith.
In predicting large market cycles with small samples, the Bayesian probability method for deriving the correlation between 25Q4 and 19Q4 is more valuable than the four-year cycle theory.
The 25Q4 criterion for 19Q4 can be converted into Bayesian formula notation: P(Bear Market | Merrill Lynch Clock Stagflation) = [P(Bear Market) / P(Merrill Lynch Clock Stagflation)] * (P(Merrill Lynch Clock Stagflation | Bear Market))
Bayesian probability parameter estimation
P (Bear Market) - Prior Probability
Since 1929: The S&P 500 has experienced 27 bear markets.
Average frequency: once every 3.5 years
Annual probability: Approximately 28.6%
Quarterly probability (Q4-Q1 span): Approximately 15-20%
Conservative estimate: P (bear market) ≈ 18%
P(Stagflation → Recession) - Merrill Lynch Clock Transition Probability
Historical probability of transition from stagflation to recession:
The stagflation of the 1970s ultimately led to three recessions in 1973-74, 1980, and 1981-82.
2000-2001: The bursting of the tech bubble and a mild recession
2007-2008: Financial crisis, deep recession
2011-2012: European debt crisis, not fully recovered (avoided)
2018-2019: Trade war concerns, successful soft landing
Statistical estimation:
There have been approximately six "stagflation → recession" scenarios in the past 50 years.
Four of them turned into a recession (66%).
Two soft landings (34%)
Current environment adjustments:
The Federal Reserve actively cut interest rates (vs. passively raised interest rates in the 1970s).
Labor market resilience (vs. 2008 financial systemic risk)
Tariff policy uncertainty
Global pressure to de-dollarize
Estimated: P(stagflation → recession) ≈ 40-50% (median 45%)
P(Stagflation → Recession | Bear Market) - Likelihood Probability
Under the condition of a bear market, the probability of experiencing "stagflation → recession":
Historical bear market classification:
Recession-type bear markets (12 times): 1929, 1937, 1973-74, 1980, 1981-82, 1990, 2000-02, 2007-09, 2020, 2022
Non-recessionary bear markets (15 times): Other technical corrections
In 12 recession-type bear markets:
Periods that experienced stagflation: 1973-74, 1980, 1981-82, 2007-08 (approximately 4 times).
Those that did not experience stagflation: 1929 (deflation), 2020 (pandemic impact), 2022 (pure inflation).
Estimated: P(Stagflation → Recession | Bear Market) ≈ 33%
Bayesian computation
Standard formula:
P(Bear Market | Stagflation → Recession) = P(Stagflation → Recession | Bear Market) × P(Bear Market) / P(Stagflation → Recession)
= 0.33 × 0.18 / 0.45
= 0.0594 / 0.45
= 0.132 = 13.2%
Scenario Analysis Matrix
Key Difference Analysis: Why is the probability low?
Overall Conclusion
P(25Q4-26Q1 Bear Market) ≈ 15-20%
Confidence interval:
Lower limit (optimistic): 12%
Median (benchmark): 17%
Upper limit (pessimistic): 25%
Strategy
Tactical defense is needed, not strategic retreat.


You May Also Like

GOP lawmaker sues ex-wife who accused him of throwing boiling water on her
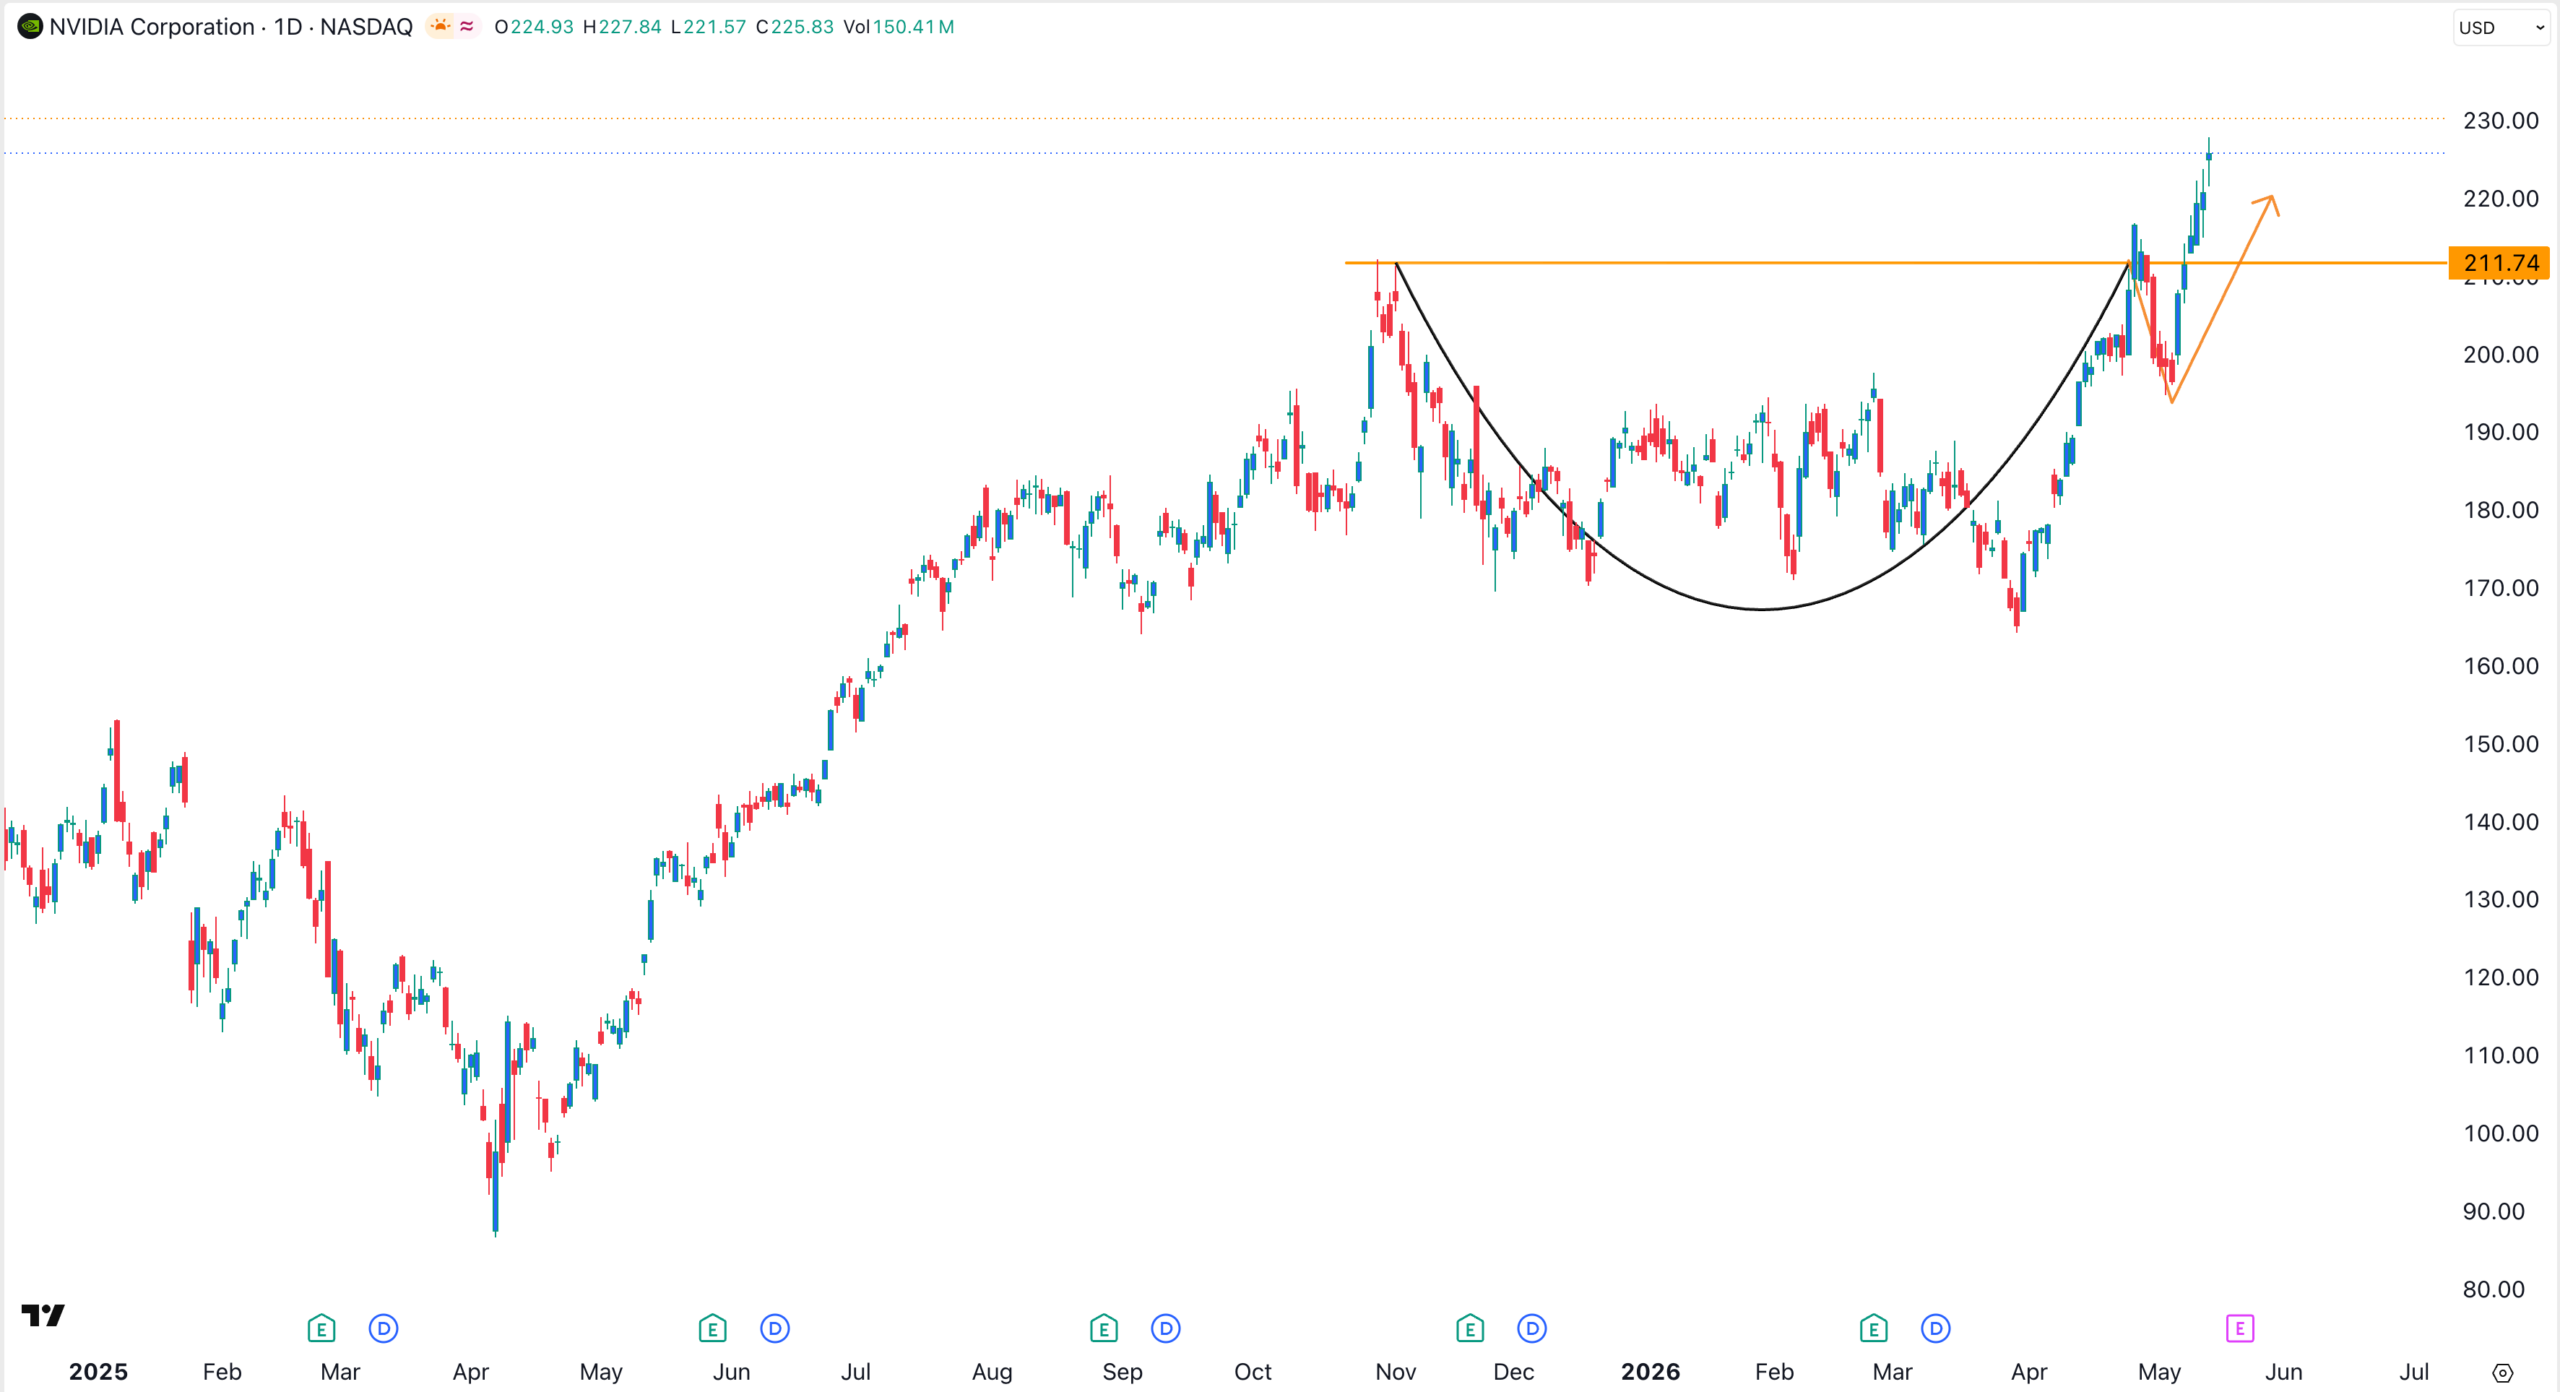
NVIDIA Stock Forecast as the US Clears H200 Chips Sales to China