

Who’s Selling Bitcoin? Fidelity Research Boss Breaks It Down
Visible buying from spot bitcoin ETPs and corporates has not translated into decisive upside, leaving traders to ask a blunt question: who is supplying the market?
For Chris Kuiper, CFA, vice president of research at Fidelity Digital Assets, the answer is clear. “ ‘Who is selling?’ is the number one question I’ve been getting regarding bitcoin’s continued price pressure against a backdrop of visible buying,” he wrote on X on November 12. “I’m not unique in suggesting it’s the long-term holders (or HODLers).”
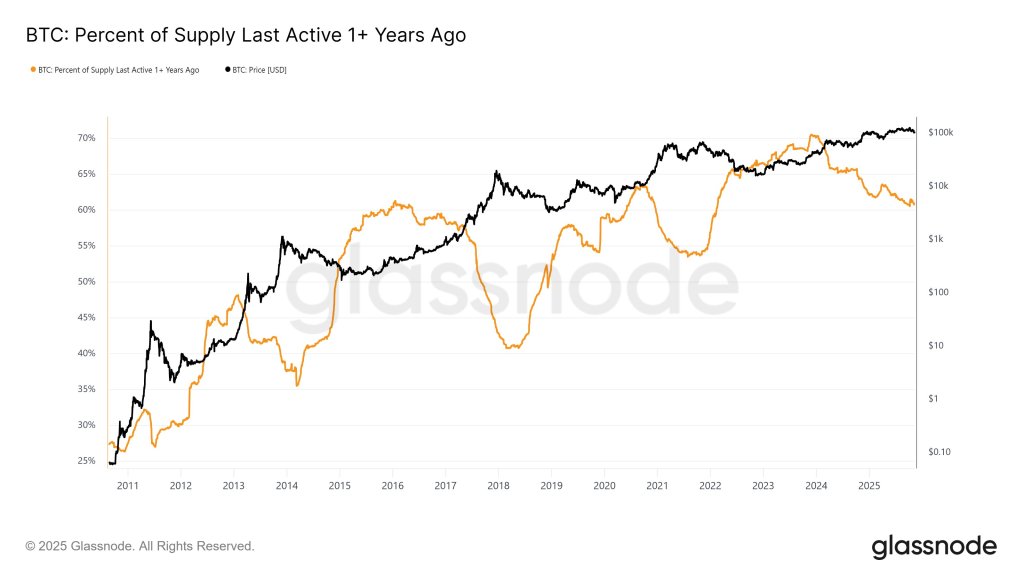
Kuiper points to a simple but powerful on-chain gauge: the percentage of outstanding bitcoin that has not moved for at least one year. Glassnode’s “Percent of Supply Last Active 1+ Years Ago” rises in bear markets as coins age in place and investors sit on unrealized losses, then typically falls sharply when bull markets let those same investors exit into strength.
“As you can see in the chart below, this line goes up during bear markets … and then usually a dramatic decline as these longer-term holders sell into the strength of a bull market,” Kuiper explained. What stands out to him today is that “with this cycle” the drawdown is “a relatively gentle slope down.” When bitcoin hit new highs earlier this year, the long-term-holder line “didn’t plunge,” he said. Instead, the market has been experiencing “a consistent slow bleed as the market has slowly moved sideways and up.”
That slow bleed aligns with what Kuiper says he hears from the client side. “Bitcoin’s performance has recently lagged gold’s, even the S&P, and people are getting tired,” he wrote. Many investors, in his view, had been positioned for a textbook four-year cycle blow-off and were “waiting to sell into the historically strong seasonality of October and now November.”
When October’s typical strength did not materialize and year-end approached, “long-term holders are looking to make year-end tax and positional changes, calling it a day with the gains they already have.”
The Glassnode chart shows how different this looks from past cycles. In the 2017–2018 run-up and subsequent reversal, the share of coins last active more than a year ago rolled over violently as price spiked and then collapsed. In the current cycle, the curve that represents long-term-holder supply has been trending lower since 2023, but without the vertical collapse normally associated with euphoric distribution.
On-chain analyst Julio Moreno of CryptoQuant added another layer by reframing the same dynamic as “1-year inactive supply drawdown” in percentage points of total supply. “Here’s another way to visualize this,” he replied to Kuiper, “by looking at the 1-year inactive supply drawdown in terms of % of total Bitcoin supply.”
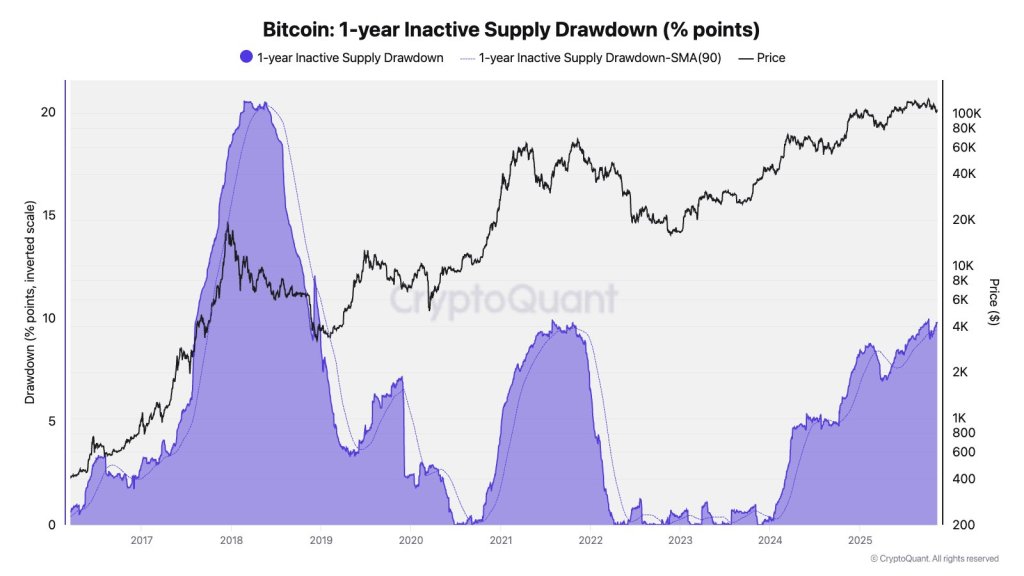
Moreno quantified the last three major cycles. In 2017–2018, 1-year inactive supply declined by about 20 percentage points of total supply. In the 2021 cycle, the drawdown was around 10 percentage points. In the 2024–2025 period so far, the decline is again roughly 10 percentage points. The CryptoQuant chart, which uses an inverted scale, renders that as a purple wave that rises as more long-dormant coins are spent or reallocated.
This means that long-term holders have already released a volume of supply comparable to the 2021 cycle, even if it is still well below the 2017–2018 peak. What differs is the tempo. Rather than a short burst of profit-taking at the top, the market has absorbed roughly a 10-percentage-point reduction in inactive supply over a longer, choppier price path.
Kuiper welcomed the alternative visualization, replying simply: “Great chart!” He also made clear what he will be monitoring from here. “I will be watching this slope along with some other metrics to gauge seller exhaustion,” he said. For now, he argues that “the positive fundamental developments and lackluster price action continue to diverge.”
At press time, BTC traded at $102,609.


You May Also Like

Not a loophole: Singapore AI export controls let China tap US AI legally

Exclusive interview with Smokey The Bera, co-founder of Berachain: How the innovative PoL public chain solves the liquidity problem and may be launched in a few months

Iran’s army chief warns of ‘total destruction’ for ground invasion


