

Bitcoin Coinbase Premium Still Negative: US Institutions Keep Selling Despite Easing Pressure
Bitcoin has pushed back above the $90,000 level after several days of intense selling pressure, bringing a brief moment of relief to a market overwhelmed by fear and uncertainty. Despite the rebound, bulls remain under pressure as speculation of an incoming bear market continues to grow. Many investors are still digesting the sharp correction from October’s all-time high, and confidence has yet to fully return.
According to top analyst Darkfost, one of the key indicators reinforcing this cautious environment is the Coinbase Premium Index, which remains negative. This metric compares Bitcoin’s price on Coinbase — the preferred exchange for US institutions and professional investors — with Binance, which is widely used by retail traders. When the index is negative, as it is now, it signals that institutional players and US whales are selling more aggressively than retail participants.
Darkfost notes that part of this ongoing sell-side pressure is tied to continuous spot ETF outflows, which have weighed heavily on sentiment. Although the recent bounce above $90K shows a temporary shift in momentum, Bitcoin must demonstrate strong follow-through to prevent the market from slipping deeper into a bearish phase.
Institutional Selling Pressure Begins to Ease
Darkfost explains that since the peak in panic selling on November 21, institutional and US-based selling pressure has noticeably cooled off. During that period, the Coinbase Premium Index showed a sharp dive into negative territory, signaling that professional actors were offloading Bitcoin far more aggressively than retail participants. This imbalance amplified the market’s decline, helping push BTC toward its recent lows.
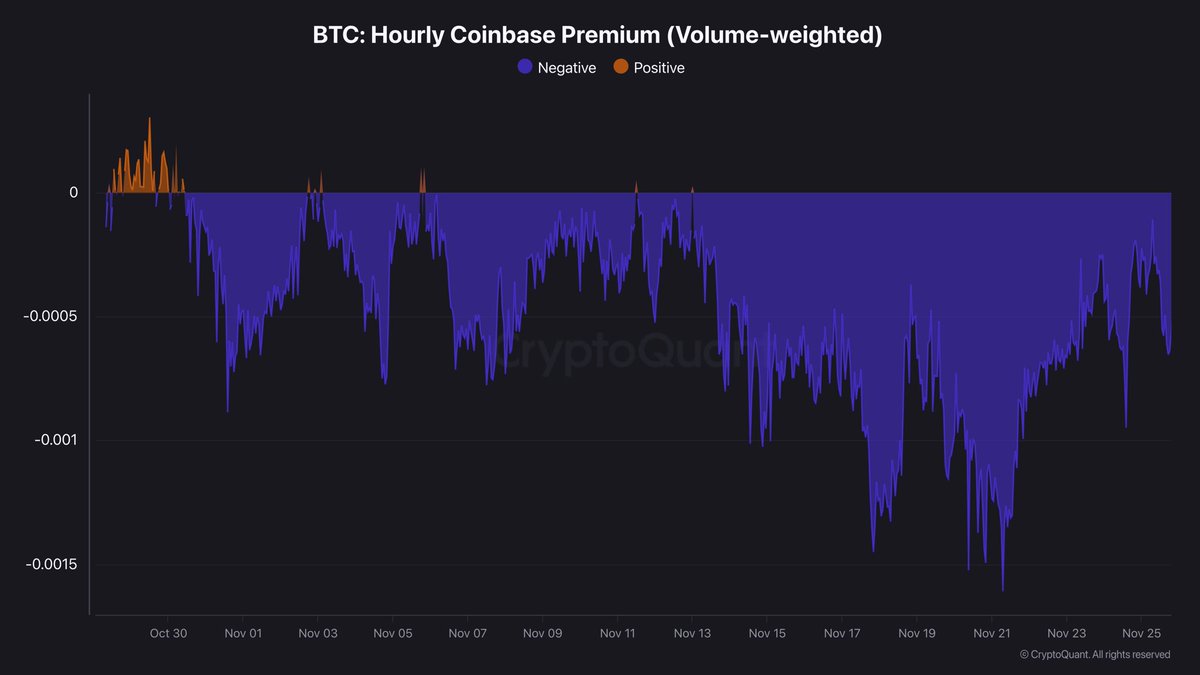
However, over the past several days, the intensity of this selling has started to fade. While the Coinbase Premium Index remains negative — meaning institutions are still net sellers — the depth of that negativity has significantly softened. Darkfost notes that although the metric has not yet flipped into positive territory, the trend is improving. If this continues, it could give the market some much-needed breathing room and potentially stabilize price action.
Still, analysts remain cautious. The next few sessions will be critical, as Bitcoin needs to demonstrate that this easing in sell pressure can translate into sustained demand. A decisive move — either reclaiming higher levels or breaking down again — appears imminent. As institutional activity continues to shift, the market may soon reveal whether this was only a temporary relief bounce or the start of a larger recovery.
Bitcoin Attempts Recovery But Faces Key Resistance Levels
Bitcoin is showing its first meaningful recovery attempt after the steep decline that dragged price from the $126,000 all-time high down to the $80,000 zone. On the 3-day chart, BTC has bounced sharply from the 200-day moving average (red line), a level that historically acts as a major dynamic support during deep corrections. This rebound pushed price back toward the $91,000 area, but momentum remains fragile.

The chart shows BTC trading below both the 50-day and 100-day moving averages, which have now turned downward—an indication of short-term trend weakness. Until the price reclaims these moving averages, particularly the 100-day near $103,000, the broader structure remains vulnerable to further downside.
Volume during the sell-off was substantially higher than during the bounce, suggesting that sellers were more aggressive than buyers. This imbalance highlights that the recent uptick may be more of a reactionary relief move than a confirmed reversal.
Still, the rejection wicks below $85,000 show clear buyer interest at lower levels. If BTC can maintain this higher low structure and continue closing above the 200-day MA, bullish momentum could gradually rebuild.
Featured image from ChatGPT, chart from TradingView.com


You May Also Like

How Bitcoin Mining Becomes the Hardest Defense System for Your Wealth

Ripple (XRP) vs Solana (SOL): Which Altcoin Has Greater Potential in Q2 2026?


