

Dogecoin Flirts With Long-Term Breakdown At Monthly Ichimoku Floor
Dogecoin is trading directly on top of a long-term support band defined by its monthly Ichimoku cloud, according to a chart shared by crypto analyst Cantonese Cat (@cantonmeow) via X. The analyst summed it up by saying DOGE is “licking the bottom of its monthly Ichimoku cloud.”
Dogecoin Hovers At Key Monthly Ichimoku Support
The 1-month DOGE/USDT chart on Binance, captured on 7 December 2025, shows Dogecoin at around $0.14050, down about 3.8% for the month so far. The monthly candle opened at $0.14599, reached a high of $0.15340 and a low of $0.13177, underlining relatively tight but clearly downward monthly price action.

On the chart, the Ichimoku indicator uses standard 9-26-52-26 settings. The fast conversion line (Tenkan-sen) currently sits near $0.20092, and the base line (Kijun-sen) around $0.27491. The leading spans that form the cloud are plotted near $0.23792 and $0.26674, producing a forward-projected red Kumo that extends well into 2026.
With DOGE at roughly $0.14, price is trading far below both Tenkan and Kijun and is positioned just at the lower boundary of the projected cloud.
That lower cloud edge, which bends into the low-$0.12 to mid-$0.13 area before flattening, is the zone highlighted by Cantonese Cat. The October monthly candle shows a long lower wick that briefly pierced deep below, toward the mid-$0.06 region, but closed back above the cloud floor. The current, still-forming candle again tests just under that boundary and is, at the time of the snapshot, holding marginally above it around $0.14.
For Ichimoku practitioners, the lower Kumo boundary is often treated as the final structural support in a still-constructive higher-timeframe trend. In this case, the implication of the chart is clear: as long as monthly closes remain above roughly $0.12–$0.14, the multi-year structure can still be interpreted as a long-term bottoming zone rather than a completed breakdown.
In other words, for this analyst, Dogecoin’s prospective bottom hinges on whether that monthly Ichimoku support band in the $0.12–$0.14 range continues to hold.
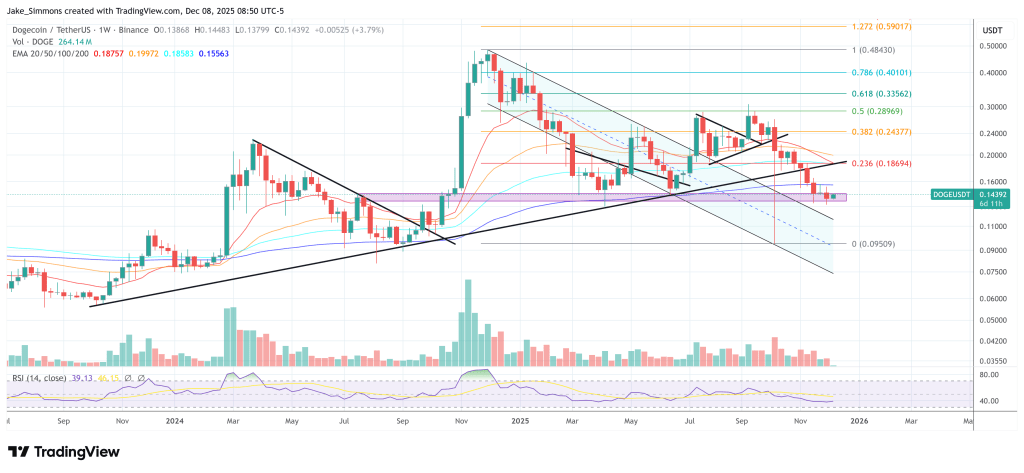
DOGE Sits Inside Key Support Zone In The Weekly Chart
On the weekly DOGE/USDT chart, price is sitting directly in the highlighted red support zone around $0.135–$0.145. This band coincides with a prior multi-week consolidation area and a former horizontal resistance level that capped price before the last major breakout.
Over the past several candles, weekly closes have clustered inside this zone while wicks repeatedly probe through it, underlining how aggressively the market is testing this level. The current candle trades near $0.14392, keeping Dogecoin inside the upper half of the support block but still below the 20-, 50-, 100- and 200-week EMAs, with the 200-week EMA at $0.15563 now just overhead.
At the same time, DOGE has clearly lost the rising black trendline that had connected higher lows from the left side of the chart. After breaking beneath this trend support, the DOGE price dropped sharply. The intersection of the broken trendline and the nearby moving averages now forms an overhead supply region, meaning price is compressing between these levels and the red horizontal support zone.


You May Also Like

The changing face of elder care in Malaysia — Sayed Mohammad Reza Yamani Sayed Umar

Covéa Chooses Shift Technology as Strategic Partner for Fraud and Risk Management

Not a loophole: Singapore AI export controls let China tap US AI legally


